Note: Posts on this site are for education purposes only. They provide one firm’s insight on the markets. Not investment advice. See additional disclaimer here.
Note: Posts on this site are for education purposes only. They provide one firm’s insight on the markets. Not investment advice. See additional disclaimer here.
About a year after Teddy Roosevelt left office, Wyckoff published his seminal work; Studies in Tape Reading. That year, was 1910.
Wyckoff was the one that defined support, resistance, accumulation and distribution.
He was the one that discovered markets have a power of their own; having nothing to do with any fundamentals.
Wyckoff found that if you can decipher price action, you can determine the most probable direction.
A first edition Wyckoff ‘Tape Reading’ text … if you can find it, goes for about $3,500.
Even lesser known books of Wyckoff such as this one, go for hefty sums.
In his ‘Tape Reading’ text, on page 102, he shows a diagram that represents price action exhaustion.
His discussion (repeated below) is concerning the bull side.
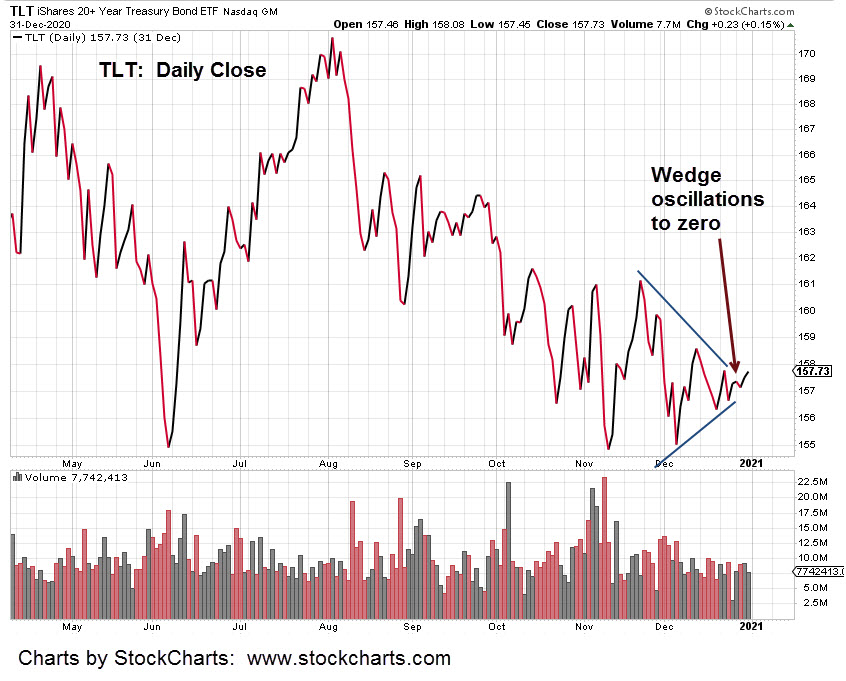
For today’s chart of TLT, we’ll mentally swap every ‘bull’ notation from Wyckoff with ‘bear’ and conversely, every ‘top’ notation with ‘bottom’, every ‘buy’ notation with ‘sell’ and so on.
“ … and you see what the chart of a stock or the market looks like when it reaches a point of dullness.
These dull periods often occur after a season of delirious activity on the bull side. People make money, pyramid on their profits and glut themselves with stocks at the top. As everyone is loaded up, there is comparatively no one left to buy and the break which inevitability follows would happen if there were no bears, no bad news or anything else to force a decline.”
The ‘dull’ period he is discussing is shown below in TLT. It has repeated the diagram on his page 102, in near identical fashion.
We have supplementary evidence from Steven Van Metre during this report, the bond bears have started to back off their historic short positions.
They are trapped and exhausted; all their selling has not collapsed bonds as anticipated.
So, let’s see what happens next. According to a text written 110-years ago, we are expecting a rally in bonds .. a massive rally.
Note: Posts on this site are for education purposes only. They provide one firm’s insight on the markets. Not investment advice. See additional disclaimer here.
Note: Posts on this site are for education purposes only. They provide one firm’s insight on the markets. Not investment advice. See additional disclaimer here.
Note: Posts on this site are for education purposes only. They provide one firm’s insight on the markets. Not investment advice. See additional disclaimer here.