Massive Trading Channel In GDX

The past week has been a frustrating one being short the gold market.
Is the current trade, DUST-21-01, in a correction or an outright reversal?
It’s in the green (not advice, not a recommendation) but seems like it’s taking forever to get moving.
Paraphrasing Dr. Elder; He says ‘when in doubt, pull out (or farther out).’
So, we’re going to do just that.
Senior Miners, GDX
The un-marked daily chart is below. The second one is the same but inverted (to approximate inverse fund DUST).

Inverted
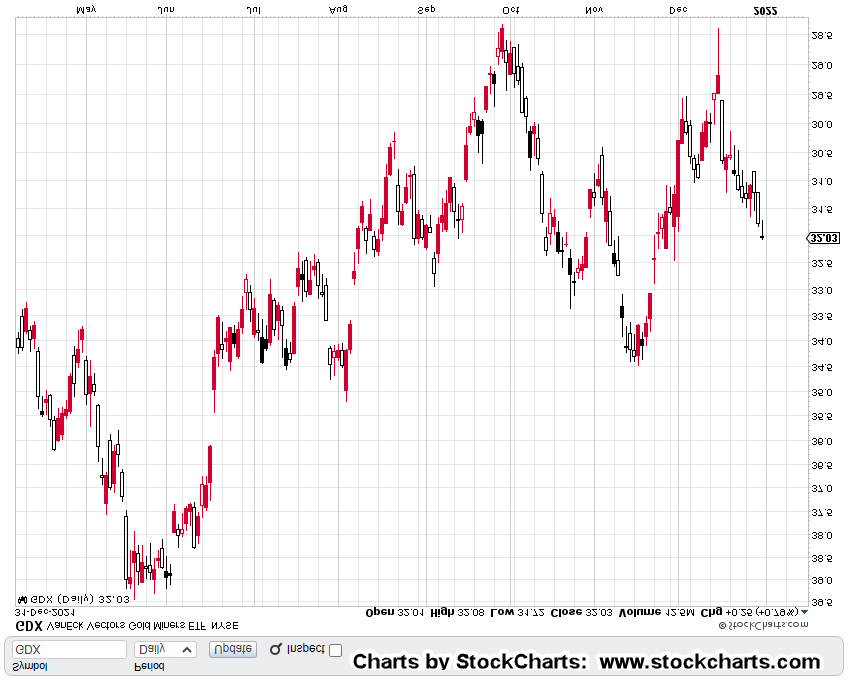
From the blank charts, it’s not immediately obvious.
However, the chart below shows GDX in a massive trading channel.
On top of that, today (Friday) may have been contact and verification of the right-side channel line. We won’t know for sure, until next week.

There’re about nine-months of trading action which also includes the two months to create the up-thrust set-up.
Sitting Back
If you sit back and take it all in, one begins to realize the enormity of what’s going on.
The up-thrust set-up was formed in two months. The channel itself, the bigger picture is nearly a year of price action.
From the inverted chart, the spike (downward) December 15th to now, is when the market thinned-out.
That’s when based on the data, funds flowed out of the senior miners and (some of it) into the last man standing; Newmont (NEM).
The stage is set.
Summary
Trades can fail. Anything can happen. That’s a given in the markets.
However, it looks like GDX is at another critical juncture.
Stay Tuned
Charts by StockCharts
Note: Posts on this site are for education purposes only. They provide one firm’s insight on the markets. Not investment advice. See additional disclaimer here.
The Danger Point®, trade mark: No. 6,505,279

Pingback: Time Tunnel … GDX « The Danger Point®
Pingback: Fibonacci Fingerprint « The Danger Point®
Pingback: Gold Bulls … What Happened ? « The Danger Point®