If There’s One, There’s Probably More …

How many biotech ‘outfits’ are at risk of being incinerated during a market implosion?
For activist short-seller, Scorpion Capital, they’ve found at least one and they’re not mincing any words.
They sate: Twist Bioscience (TWST) is ‘cash burning inferno‘ and then go on to say:
Price target for TSWT, is Zero.
Their report supporting that assessment is linked here.
Note: It’s 236-pages, long!
Maybe it’s a one-off.
However, considering the other market implosions in just the past week, probably not.
As is typical for an equity in a long decline, the lawsuits have already started.
Other implosions just in the past seven days, are FTX, and Twitter. Maybe, Amazon (AMZN) will be next.
Analysis, vs. Antics
Seems like every other week or so, we’ve got some kind of Alpha, Beta, Delta, Gamma, extreme du jour, that’s supposed to cause ‘fireworks‘.
Reporting on fireworks, does not help navigate the current (or any future) situation.
What does help, is to clearly and without bias, assess what price action’s telling us.
We’ve already analyzed the biotech sector many times over as (potentially) the index most susceptible for a severe decline if not outright implosion.
That implosion may already be underway (not advice, not a recommendation).
Back To Wyckoff
Wyckoff analysis pointed us to biotech over a year ago.
Now, as is typical, the truth is starting the come out; a trickle at first …
So, for today’s update were going shift gears and follow-up on the prior two posts here and here.
We’ll take another look at the S&P (SPY); specifically, the weekly chart.
S&P 500, Weekly
The weekly is shown with trendlines.
Looking at those lines, is there any other basis for drawing them at the location shown?
The short answer is yes and it’s on the second chart.

The chart below has a Fibonacci time correlation for the trendlines, now, potential trading channel.
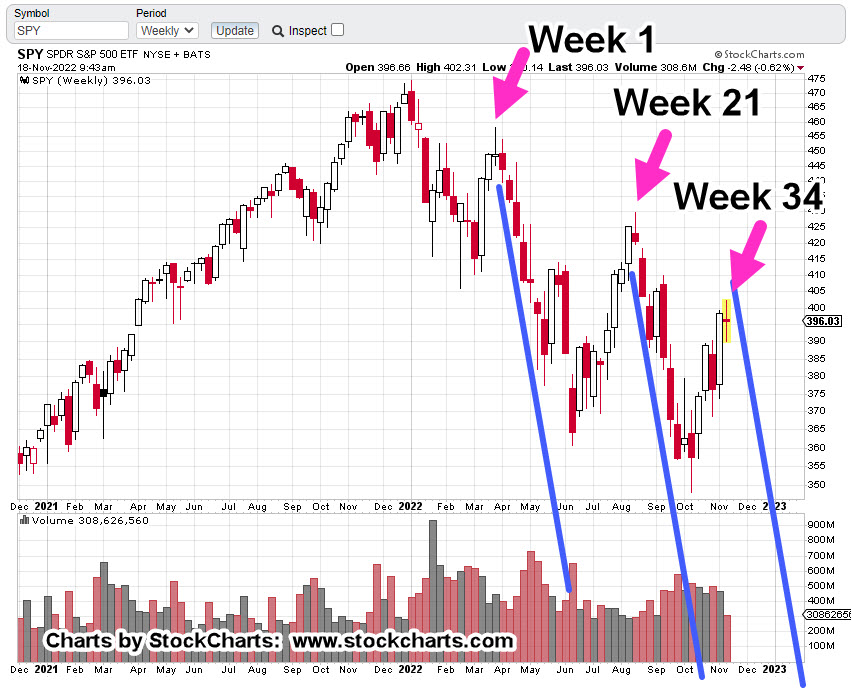
We’re currently at Week 34, from the beginning of the (potential) channel.
It may be something, it may be not.
As of this post (10:07 a.m., EST), we don’t know and price action itself, is the final arbiter.
Summary
Because of the supposed ‘fireworks’ scheduled for the day, we may not know if we’re at a pivot point until next week.
That week just so happens, to be a holiday week.
Many times, this site has a presented a proprietary insight; market reversals tend to occur just before, during, or just after a holiday week.
Obviously, the most famous of these was September 3, 1929 (the day after Labor Day weekend), which was the all-time high and reversal, leading to the crash.
Stay Tuned
Charts by StockCharts
Note: Posts on this site are for education purposes only. They provide one firm’s insight on the markets. Not investment advice. See additional disclaimer here.
The Danger Point®, trade mark: No. 6,505,279

Pingback: This Week … What To Watch « The Danger Point®
Pingback: Set For ‘Implosion’ … Biotech « The Danger Point®