A Number Recurring Trough Time

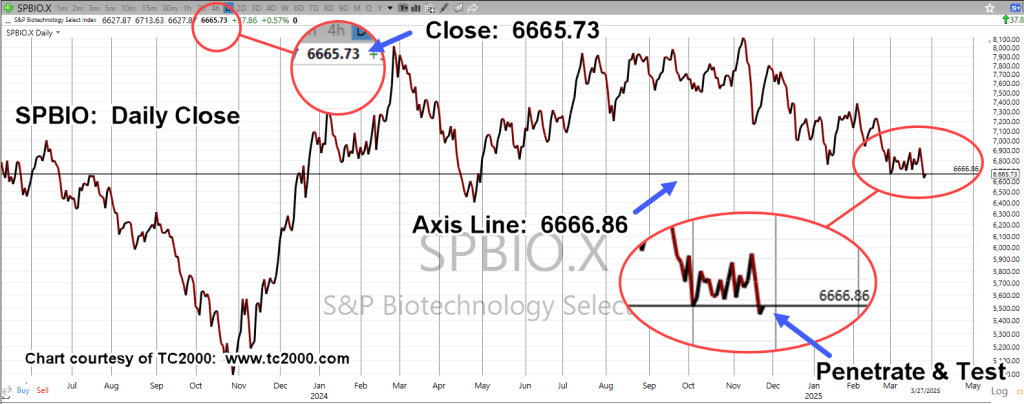
You’ll have to judge for yourself if the chart with closing numbers and axis line, are of importance.
As a reminder, let’s not forget where the S&P bottomed, in 2009.
‘The S&P hit a low of 666, intraday’
With that, this update will be brief.
Biotech Sector Index, SPBIO, Daily Close
We’re using the actual index (SPBIO) and not the XBI, ETF, typically traded as a proxy.
After hours (as of 6:53 p.m., EST) has the ETF, XBI, trading unchanged to slightly lower.
Stay Tuned
Charts by StockCharts
Note: Posts on this site are for education purposes only. They provide one firm’s insight on the markets. Not investment advice. See additional disclaimer here.
The Danger Point®, trade mark: No. 6,505,279

Pingback: Bottoms, Tops & Tests « The Danger Point®