Note: Posts on this site are for education purposes only. They provide one firm’s insight on the markets. Not investment advice. See additional disclaimer here.
It’s hard to describe how stretched the market really is; how ‘the euphoria is so maximized’, as quoted by David Quintieri of the Money GPS.
His latest report, delves into published articles that contain one market stretched quote after another.
Perhaps, the most frightening is:”This does not feel like the top”.
You can find that report at this link. The quotes listed above and more, start around the 1:40, time stamp.
In the markets as of this post (2:08 p.m. EST), biotech (IBB) continues to erode throughout the session.
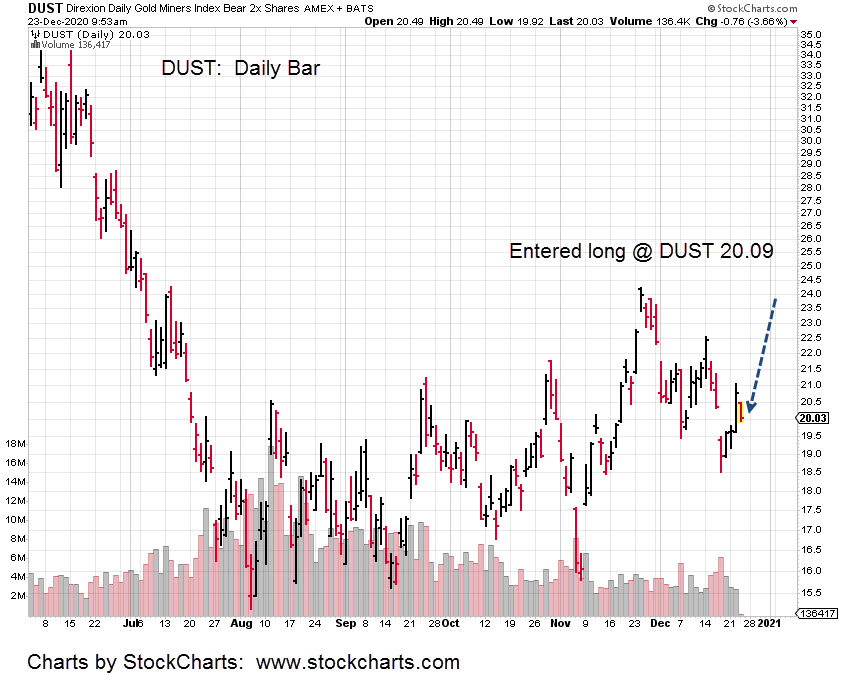
The firm has made one LABD (3X, Inverse) and two BIS (2X, Inverse) entries this session so far. Not advice, not a recommendation.
Note the stop progression on BIS entries.
Positions are below; not advice, not a recommendation:
Note: Posts on this site are for education purposes only. They provide one firm’s insight on the markets. Not investment advice. See additional disclaimer here.
It’s been a while since biotech (IBB) was on the radar.
We’re going to look at the thirty-minute chart of 2X Inverse fund BIS, to show the change in character.
The first two oval areas after each up move in BIS (IBB down), was fully retraced. Not only that, the retrace occurred on the same day.
Not so with the last oval, today.
BIS has a changed character. The thirty-minute bar was not retraced; telling us we’re at the danger point where the risk is least.
Both the weekly and daily MACD indicators show momentum has shifted; stalled (on weekly) and has turned lower on the daily.
As far as shorting the biotech sector, any takers? It’s not like the other crowded trades; Dow, NASDAQ, S&P, and on.
As this post is being written BIS is edging back slightly to the entry point @ BIS, 22.23.
In so doing, there may be an hourly trend line forming. If that happens, updates will be forthcoming.
Note: Posts on this site are for education purposes only. They provide one firm’s insight on the markets. Not investment advice. See additional disclaimer here.
Note: Posts on this site are for education purposes only. They provide one firm’s insight on the markets. Not investment advice. See additional disclaimer here.
Note: Posts on this site are for education purposes only. They provide one firm’s insight on the markets. Not investment advice. See additional disclaimer here.
“The “Christmas Bomb” cut communication lines … which by the way is the very first objective during any battle; cut the enemy’s communications.
Matter of fact; that could be the ‘reason’. A test to see how badly communications were disrupted; how quickly they recovered.“
At time stamp 2:00 in this link, Salty Cracker shows the AT&T outage map; nearly half of the U.S. has been affected.
Next week, the markets could rally on such news. Anything can happen.
However, lack of communication means lack of commerce … for an unknown amount of time.
Downside action would seem more probable.
There’s still one more day before the open on Monday … seems like a long way away.
It’s possible by that time, participants will want the safety of bonds.
Bonds that are already sold-short, the most in history.
Stay Tuned
Note: Posts on this site are for education purposes only. They provide one firm’s insight on the markets. Not investment advice. See additional disclaimer here.
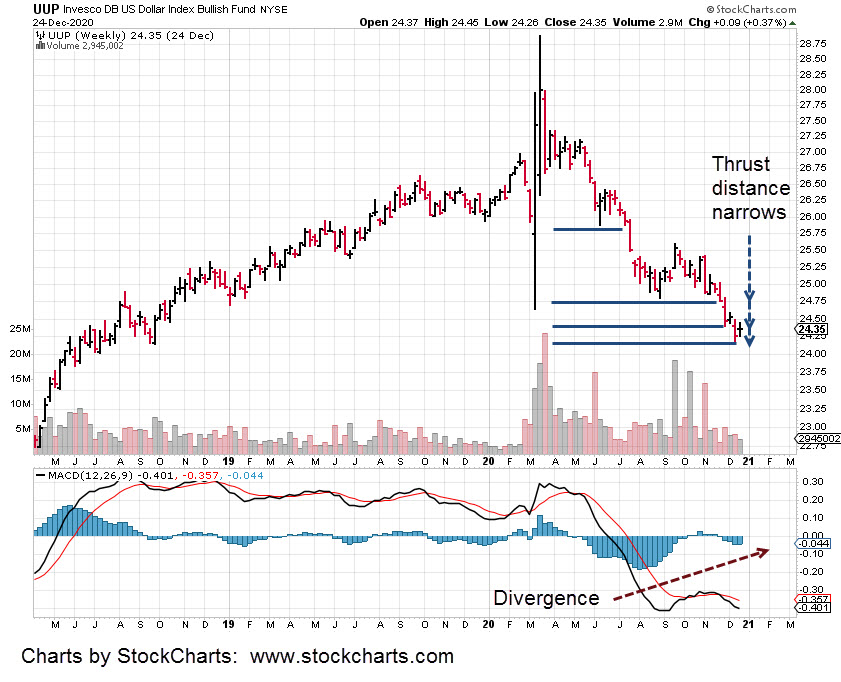
The downward thrusts in the dollar have run their course.
The weekly chart of UUP, shows successive narrowing of distance traveled to the downside.
The bears may have reached exhaustion at the same time MACD shows a bullish divergence.
Couple that with extreme shorting from the speculators; the trap is set, ready to close.
From a technical perspective, note last week’s price action was inside and at the top of the price range from the week prior.
Looking at the week before that, we see price action was inside but at the bottom of the range of the week prior.
These are subtle clues; there’s a change in character.
As mentioned in previous updates, it’s all happening during holiday weeks when everyone (almost everyone) is distracted.
No matter what happens on the political side, it’s likely to be chaos. February, is setting up to be very different from now.
We’re using Livermore’s strategic approach to the markets. That is, figure out what’s going to happen in a big way … then get in position.
Built into that approach is recognition there will be market outages, trading halts, communication interruptions and natural disasters.
The one thing that may separate this site from others, these (potential) events are taken into account.
Seismic activity is picking up in a big way right along with volcanic eruptions. A major eruption that will block the sun and kill-off global harvests or planting, may be in the works
The “Christmas Bomb” cut communication lines … which by the way is the very first objective during any battle; cut the enemy’s communications.
Matter of fact; that could be the ‘reason’. A test to see how badly communications were disrupted; how quickly they recovered.
Continuing on with potential disruptive events; There were broker outages on November 9th, when the market opened sharply higher.
If it happens on the way up, it will happen on the way down.
Cyber attack has already been stated as the next gala event the elite have planned.
There’s not one market analysis site known to this firm addressing those potentials or any others.
In that sense, The Danger Point, is unique.
Obviously, there are no guarantees. Anything can happen. If one wants to day-trade, go ahead but we’re not interested.
When or if all this (or a variant of it) happens simultaneously, the general pubic is going to be stunned.
It’s possible they will see their investment accounts wiped out in a matter of weeks.
The positions remain unchanged and listed below. The look is different as it’s taken from the firm’s own trade spreadsheet. Absolutely not advice and not a recommendation.
Note the initial stop followed by the current stop.
Note: Posts on this site are for education purposes only. They provide one firm’s insight on the markets. Not investment advice. See additional disclaimer here.
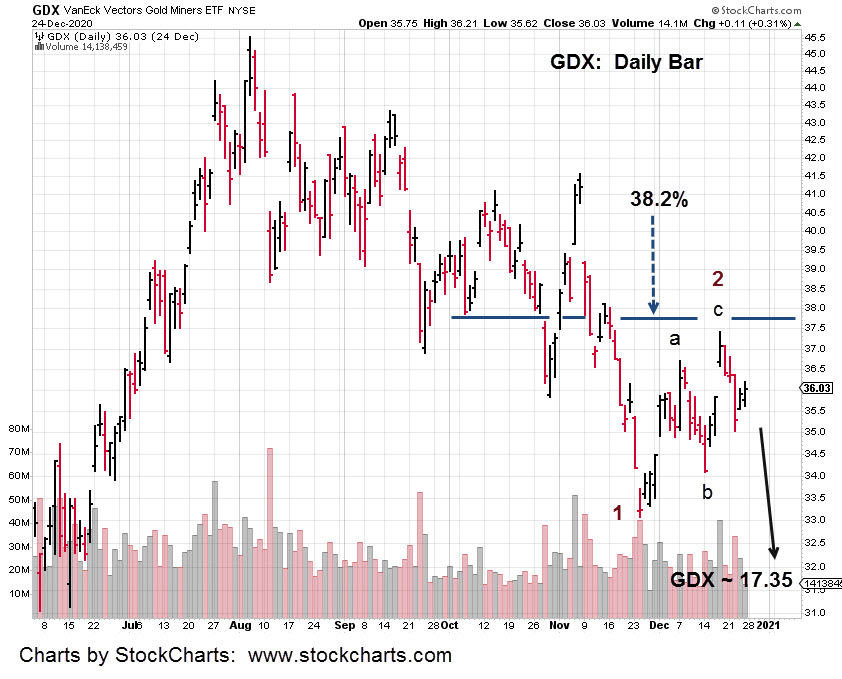
Senior Miner’s action, is counter-trend into resistance at ~ 36.20.
It was also, as the day prior, inside the bar from Tuesday, the 22nd.
Markets test wide, high volume areas. It’s what they do and it’s happening now with GDX.
The other thing happening, is a possible completion of the ‘a-b-c’ counter trend action before heading lower in Wave 3.
Wave terminology is taken from “Elliott Wave” theory.
From empirical observation, about the only time Elliott Wave is of any use, is when markets are highly emotional.
Emotional markets generate clear waves and we may be seeing that now with GDX.
As shown on the daily chart, Wave 3 projects to GDX ~ 17.35, which is a near -52% drop from current levels.
A significant upward push past the 36.20 resistance area would indicate a longer duration move to a 50% retrace.
With current GDX weakness, bonds reversing and dollar; with the ‘dumb money’ all-in, the most in history, probabilities favor downside action.
From a human interest standpoint, it’s unfortunate that so many are so ignorant about so many things.
However, the information is there to be had. We have Steven Van Metre, Sajad, J. Bravo, this site, and many others with good analysis.
Of course, one has to pull themselves away from the propaganda and actually do some work and think … which seems to be a very foreign concept for the masses, the “retail investor.”
Soft-times are over. Hard-times ahead.
Those who have poured their heart out in attempts to wake up their relatives and friends, collectively, are tired of the process.
So, this site presses on, providing decades of experience having tens-of-thousands of hours of screen time, at no charge.
It’s not unreasonable to think, providing market truth may become illegal (or too expensive) at some point very soon.
Note: Posts on this site are for education purposes only. They provide one firm’s insight on the markets. Not investment advice. See additional disclaimer here.
Note: Posts on this site are for education purposes only. They provide one firm’s insight on the markets. Not investment advice. See additional disclaimer here.
There’s something very wrong with the “hyperinflation” narrative.
The gold miners GDX can’t even get to a full 38% retrace level without collapsing.
Price action has negated the targets from the prior update.
It should be clear at this point, a monstrous 5,600 page, so-called stimulus package is not inflationary.
For an irreverent look at what’s in that bill, reference “Salty Cracker”.
By the way, just how long does it take to write 5,600 pages? A couple of years, maybe?
Probably as much time as it took to write the original CARES Act … which was submitted (put in committee) to Congress during January 2019 … a full nine months before anyone even heard of the “speck” in Wuhan.
The inference is, both of these bills were planned long ago and have been in the works for years.
Which brings us to gold and the miners.
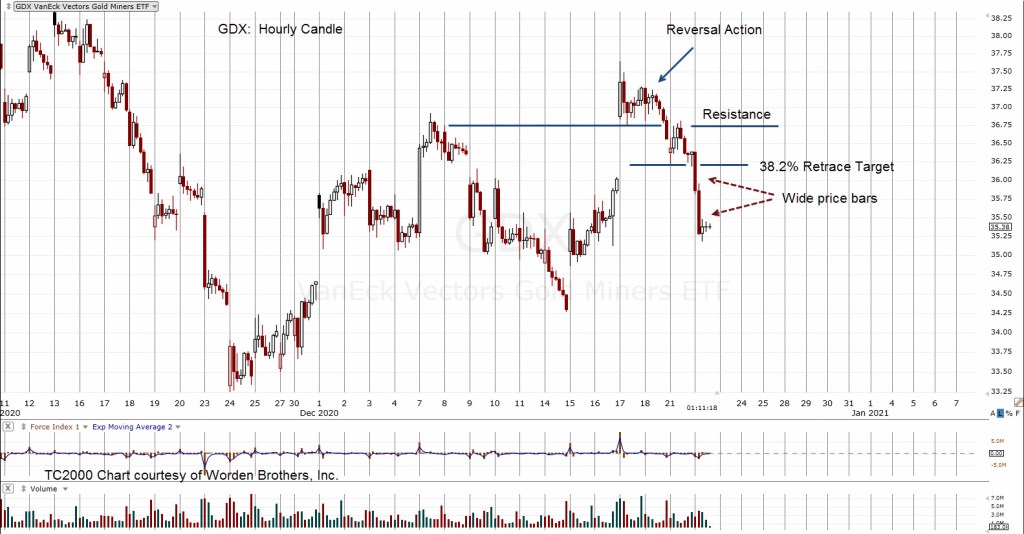
The hourly chart of GDX shows two wide bars in today’s session. The 35.00 – 35.50, area is support that may stop the down move for now.
Wide price bars usually get tested. Today’s action (as of 1:34 p.m. EST) shows GDX is moving quickly.
Expectation now, is for GDX price action to test the wide bars. That could take hours or days … or not at all.
If there is a test, the most likely stopping point is yesterday’s low at GDX, 36.18
In other markets, the short position in XOP (via DUG) is being maintained. Stop has been moved to DUG, 26.63; not advice, not a recommendation.
Note: Posts on this site are for education purposes only. They provide one firm’s insight on the markets. Not investment advice. See additional disclaimer here.