The chart of Uber is similar to biotech XBI, from last year, link here.
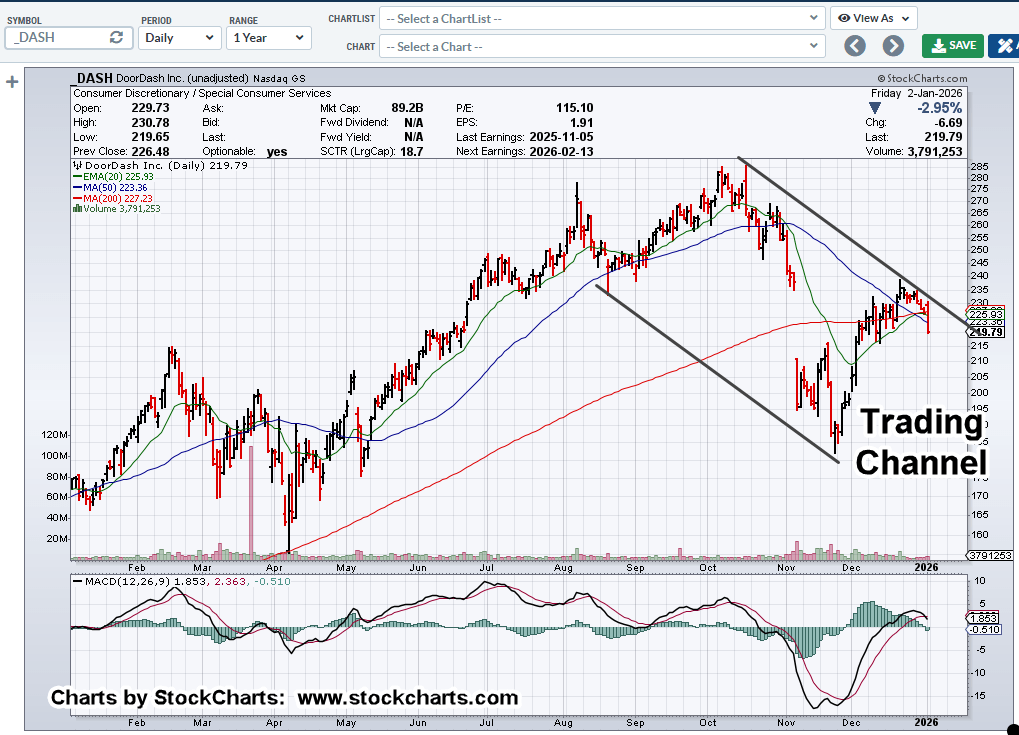
Back then, it looked like there was a breakout from a trading channel.
That update said:
“If the trendline is in-effect, meaning the market’s hanging in mid-air in a false breakout, getting back into that trend may result in some dramatic downside action.”
That’s what happened. Biotech collapsed in to the ‘Tariff’ meltdown.
Is that where we are now, with UBER? (not advice, not a recommendation).
Note: Posts on this site are for education purposes only. They provide one firm’s insight on the markets. Not investment advice. See additional disclaimer here.
Note: Posts on this site are for education purposes only. They provide one firm’s insight on the markets. Not investment advice. See additional disclaimer here.
Note: Posts on this site are for education purposes only. They provide one firm’s insight on the markets. Not investment advice. See additional disclaimer here.
Note: Posts on this site are for education purposes only. They provide one firm’s insight on the markets. Not investment advice. See additional disclaimer here.
The latest out from ZeroHedge, says that Michael Burry (a.k.a., The Big Short), while claiming Tesla is overvalued (current P/E, 271), does not have a short position.
Adding to the ‘overvaluation’ theme, is deterioration in sales that’s now entering its second year; here and here. Yet, TSLA just made all-time highs this past December 22nd.
In a nutshell, this is the problem with ‘fundamentals’.
Meaning, as far as assessing price action probability, they’re not useful and never have been (not advice, not a recommendation).
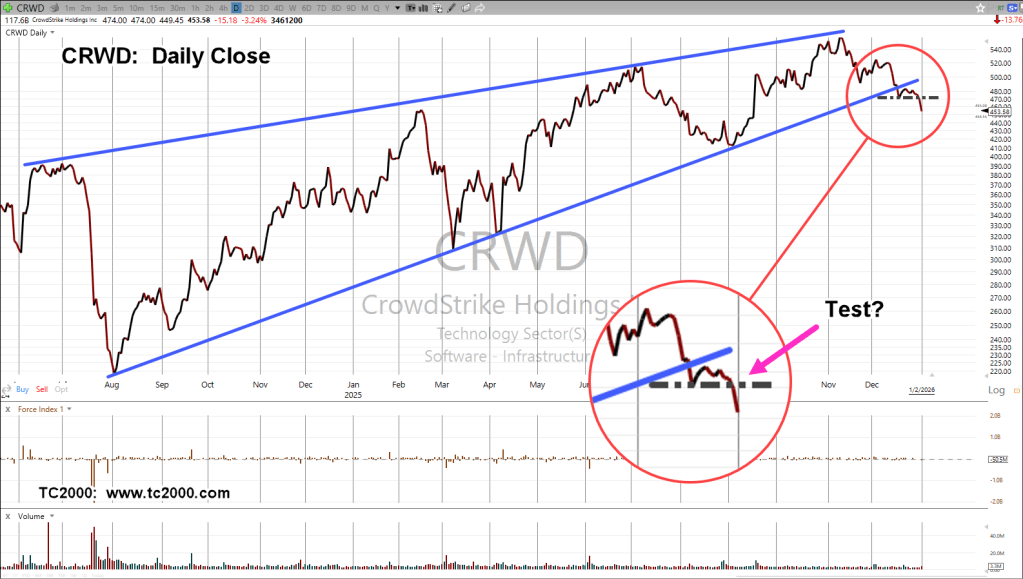
A good example of that premise is CrowdStrike (CRWD); with its current P/E, at minus 428. That’s a negative.
When their P/E, is positive, which is not often, we get numbers like 786; yet, the closing price (yesterday) for CRWD was 468.76, with a market cap of 119.4 billion.
How does that even work?
Possibly more entertaining from the ZeroHedge link, are the comments. All kinds of reasons not to short Tesla.
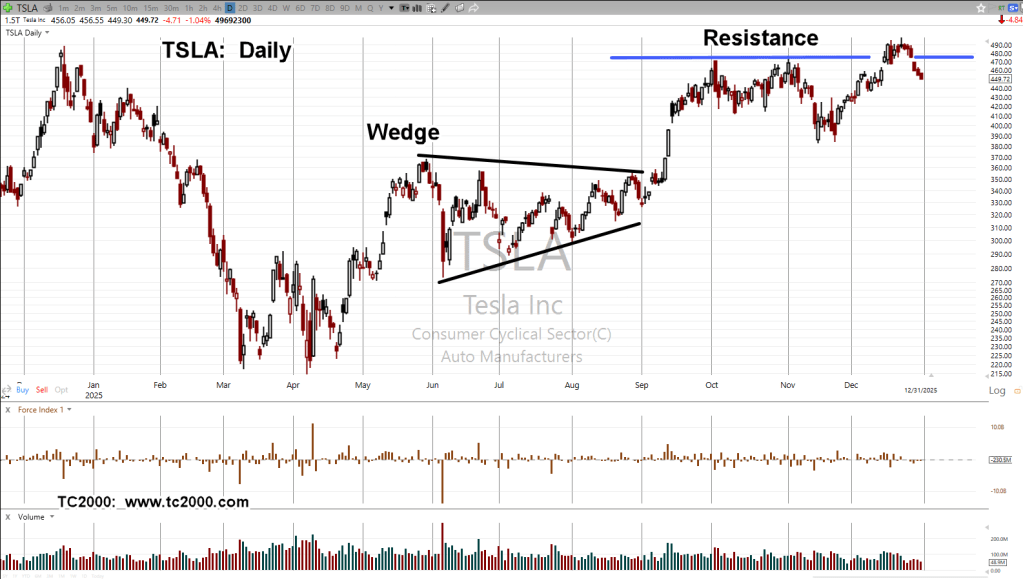
Tesla TSA, Daily
What do you see?
TSLA printed an all-time high on an attempted breakout that has so far, fallen below resistance.
On the sell side, is of course, to short TSLA directly.
Not wanting to be completely exposed to any untoward action, one can short Consumer Discretionary XLY, and effectively short AMZN as well (not advice, not a recommendation).
Note: Posts on this site are for education purposes only. They provide one firm’s insight on the markets. Not investment advice. See additional disclaimer here.
Note: Posts on this site are for education purposes only. They provide one firm’s insight on the markets. Not investment advice. See additional disclaimer here.
Note: Posts on this site are for education purposes only. They provide one firm’s insight on the markets. Not investment advice. See additional disclaimer here.
Note: Posts on this site are for education purposes only. They provide one firm’s insight on the markets. Not investment advice. See additional disclaimer here.
This is not 1980, or 2011, says the report at this link. Website, link here.
The premise for ‘it’s different’, is the demand for ‘physical delivery’.
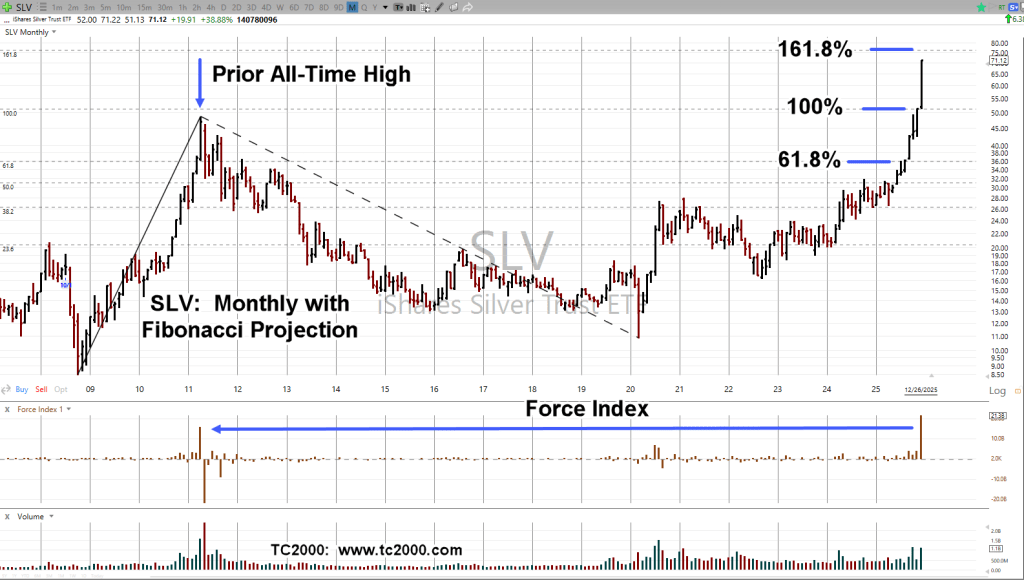
The chart in yesterday’s post, showed tracking fund SLV, very close to its Fibonacci 161.8% projection, near 76.30.
If we refer back to recent interviews with Ed Dowd, and to some extent, Bert Dohmen, they both talk about the current bubble(s).
However, Ed Dowd in particular, discusses the potential for a ‘deflation scare’.
That in turn, allows a provocative thought:
Maybe, deflationary pressures are so intense, the only way to get a blow-off mania spike (this time), is to demand delivery and stress the infrastructure (not advice, not a recommendation).
Note: Posts on this site are for education purposes only. They provide one firm’s insight on the markets. Not investment advice. See additional disclaimer here.
Note: Posts on this site are for education purposes only. They provide one firm’s insight on the markets. Not investment advice. See additional disclaimer here.





 The Danger Point®