Crowded Trades

Gold miner (GDX) bulls and bears have been fighting in a crowded trade since late November.

This morning’s GDX retrace up (and now down) from yesterday is a case in point. 

In such a choppy environment, inverse funds lose market value (downside bias) quickly and trades need to be avoided.

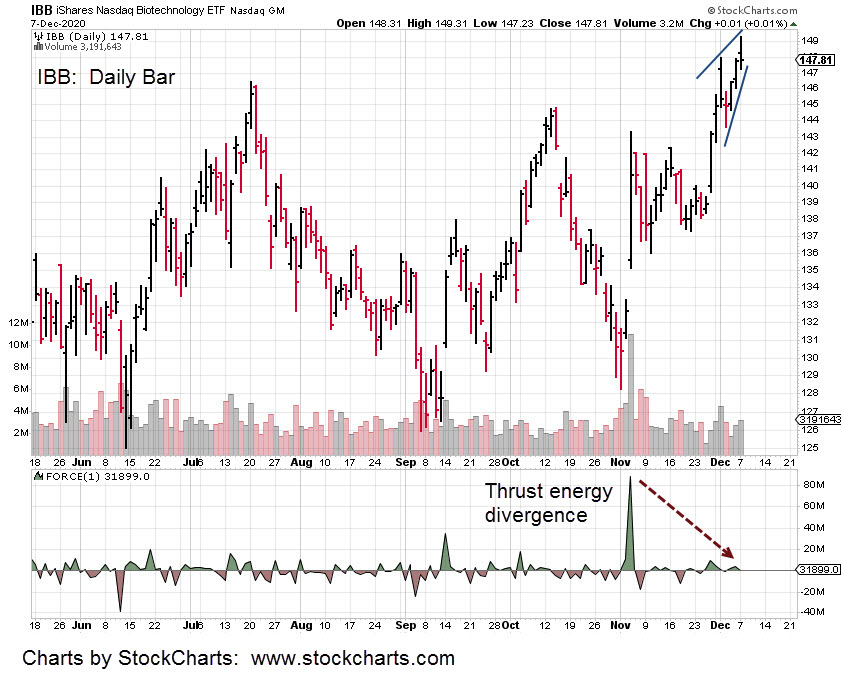
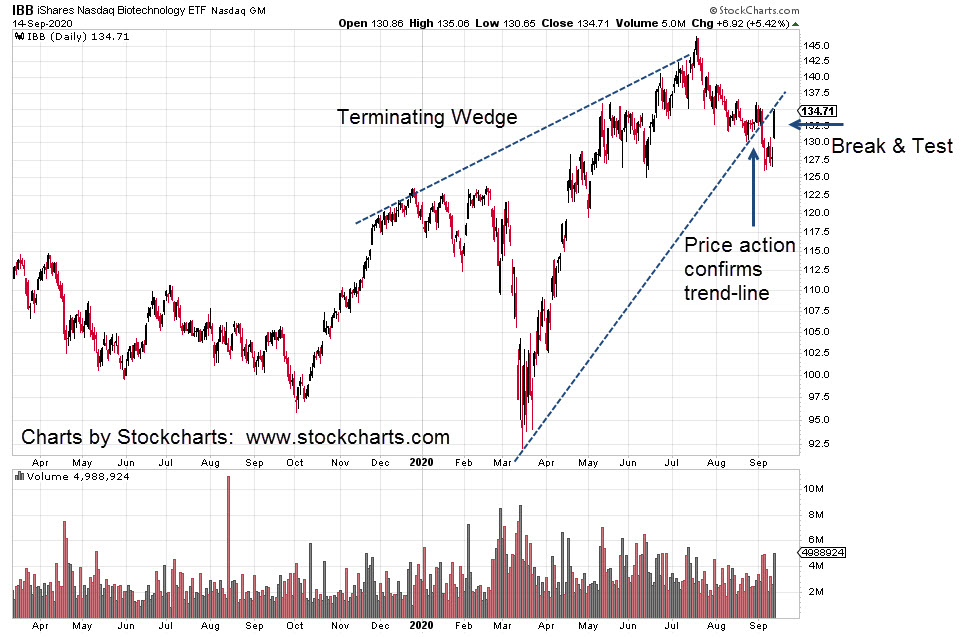
Meanwhile, on the other side of the market, biotech (IBB) has formed a top, reversed, and posted a new weekly low today.

An hourly trend-line has been formed as well (not shown). 

If it holds as (or if) IBB declines past current support (~152 area), that hourly trend is moving lower at just over -96%, annualized.

Maintaining negative trend, with declining momentum on both daily and weekly timeframes is what we’re looking for.

The objective (not advice, not a recommendation) is to move stops (shown below) and maintain the trade until stopped out or trend break.

As of this post (1:03 p.m. EST), the current price of LABD and BIS are listed in the ‘Close’ column. 

The “R-G/L” is from Dr. Van Tharp’s concept of Risk Gain/Loss.

Example:  If $1,000 of capital was “risked” (entry-to-stop) on the LABD, position, that position is now up by 6.83-R, or $6,830.

Charts by StockCharts

Note:  Posts on this site are for education purposes only.  They provide one firm’s insight on the markets.  Not investment advice.  See additional disclaimer here.

Massive Market Distortions

It’s hard to describe how stretched the market really is; how ‘the euphoria is so maximized’, as quoted by David Quintieri of the Money GPS.

His latest report, delves into published articles that contain one market stretched quote after another. 

Perhaps, the most frightening is: ”This does not feel like the top”.

You can find that report at this link.  The quotes listed above and more, start around the 1:40, time stamp.

In the markets as of this post (2:08 p.m. EST), biotech (IBB) continues to erode throughout the session. 

The firm has made one LABD (3X, Inverse) and two BIS (2X, Inverse) entries this session so far. Not advice, not a recommendation.

Note the stop progression on BIS entries.

Positions are below; not advice, not a recommendation:

Note:  Posts on this site are for education purposes only.  They provide one firm’s insight on the markets.  Not investment advice.  See additional disclaimer here.

Biotech Chart Nuances

It’s been a while since biotech (IBB) was on the radar.

We’re going to look at the thirty-minute chart of 2X Inverse fund BIS, to show the change in character.

The first two oval areas after each up move in BIS (IBB down), was fully retraced. Not only that, the retrace occurred on the same day.

Not so with the last oval, today.

BIS has a changed character.  The thirty-minute bar was not retraced; telling us we’re at the danger point where the risk is least.

Both the weekly and daily MACD indicators show momentum has shifted; stalled (on weekly) and has turned lower on the daily.

As far as shorting the biotech sector, any takers?  It’s not like the other crowded trades; Dow, NASDAQ, S&P, and on.

As this post is being written BIS is edging back slightly to the entry point @ BIS, 22.23.

In so doing, there may be an hourly trend line forming.  If that happens, updates will be forthcoming.

Note:  Posts on this site are for education purposes only.  They provide one firm’s insight on the markets.  Not investment advice.  See additional disclaimer here.

Trade Actions, Early Session

A brief list of changes:

Exit as planned on DUST. Stop was hit

Trader’s discretionary exit on DUG:  Gain ~ 4.80%

Entered short IBB via LABD (3X inverse) and BIS (2X inverse). Not advice, not a recommendation.

The biotech sector has lost momentum. 

Weekly MACD has diverged and is now flat. Additional analysis to come.

Position table is shown below:

Charts by StockCharts

Note:  Posts on this site are for education purposes only.  They provide one firm’s insight on the markets.  Not investment advice.  See additional disclaimer here.

Before The Open: Biotech

Bid/Ask spreads on Biotech (IBB) indicate a lower open.

From last night’s update, this was the expectation if we’re in the early stages of reversal.

Empirical observation over many months shows IBB, tends to move counter-trend for the first 90-minutes of trade … then resumes its original direction.

If that holds true for today (and we’re in a reversal), expect IBB to open lower and then attempt a move higher during the first hour and a half; right up to about 10:30 a.m. to 11:00 a.m. EST.

Note:  That’s empirical observation; typical market action for IBB. 

However, each day is different and price action itself has the final say.

Both accounts being managed already have significant positions (BIS & LABD) with a BIS stop @ 24.64 and LABD stop @ 27.63 in the market (not advice, not a recommendation).

Following Livermore’s approach (get in big … and do it early) the plan is to monitor price action for another opportunity. 

If somehow there’s a higher open for IBB, then we’ll wait for a lower daily low (to increase position) or be stopped out … whichever comes first.

It’s still quiet in the markets.  No one expects a major reversal.  Retail is all in (although insiders are selling en masse).

There are fundamental reasons why biotech may be about to crack (big time) but those reasons are for another report.  Here’s a preview.

Note:  Posts on this site are for education purposes only.  They provide one firm’s insight on the markets.  Not investment advice.  See additional disclaimer here.

After The Close

Culmination of probabilities; That’s what appears in Biotech, IBB

First: The 150 target identified in this post has subsequent price action reaching a 149.31, high … could be close enough

Second:  The daily chart has a small terminating wedge pattern created over the last five sessions.  A wedge is usually the last stop before reversal.

Third:  The amount of upward energy (Force Index) available to push prices higher has evaporated.  Today’s session, while closing marginally higher, had near zero energy.

Fourth:  Today’s price bar was a reversal; A higher open, higher high, followed by lower low and lower close.

Fifth:  The last reversal bar was five trading sessions ago.  That bar was negated by subsequent price action; leading up to today.

Markets alternate.  What happened the last time (negation of reversal) is not likely to happen this time.

Sixth … sort of.  The gold market and the miners (GDX) could have received a ‘safe-haven’ bid in advance of an overall market decline.  Did today’s rally in gold just signal the market top?

As of this post (8:02 p.m. EST) the overnight session (S&P) is trading lower -8.50-pts or -0.23%.  So, we’ll see.

With the above five items listed and the probable sixth, expectations are for a lower open on tomorrow’s IBB session, then adding weight to the reversal. 

Charts by StockCharts

Note:  Posts on this site are for education purposes only.  They provide one firm’s insight on the markets.  Not investment advice.  See additional disclaimer here.

Biotech (IBB) Late Session

If IBB is able to finish below resistance at 148, it will post a daily reversal bar.

Original upside target was the 150-area.  Looks like at this juncture, 149.31 may be all there is.

Hourly chart of IBB with notes, below.

Positioned short (not advice, not a recommendation), via BIS and LABD (separate accounts).

Stop:  BIS 24.64, LABD 27.63

Note:  Posts on this site are for education purposes only.  They provide one firm’s insight on the markets.  Not investment advice.  See additional disclaimer here.

Lying In Wait

That’s exactly what’s happening with biotech (IBB) and more specifically Amgen (AMGN).

Just like with Newmont and GDX from the previous update, Amgen’s the heavy hitter for the biotech sector.

What we see on the daily chart below and expandable version here, is that AMGN’s at the danger point.

Price action penetrated well established support and then stopped dead (so far).

If that’s the case, we’re looking for price action to rebound and move toward the 242 – 244 area; a 50% retrace from current levels.

If that point is reached, depending on the behavior of price action itself, the expectation is for a long-term reversal.

There have been several trades using BIS and LABD with the overall result being about break-even to slightly down.

More important than outright profit is the trading insight (over several months) into the sector itself.  That insight can only come from active positions. 

No amount of ‘paper trading’ or external analysis will provide a visceral feel for the market.

Summary: 

We’re waiting for price action in AMGN and the overall IBB, to counter-trend upward as we head into November.

If there’s an obvious reversal at that time (not advice, not a recommendation) the risk on a short position may be at its lowest.

Charts by StockCharts

Note:  Posts on this site are for education purposes only.  They provide one firm’s insight on the markets.  Not investment advice.  See additional disclaimer here.

Biotech: Election Top Closer

The October 4th, update proposed a top and reversal for Biotech (IBB) at or near the election.  November, 2nd , or 3rd, could be new highs followed by an immediate reversal.

Fibonacci week 34, from the 3/16/20 lows, is the week ending on Friday, November 6th.

The daily chart (below) has a trend that’s been confirmed; If it remains intact for the next three weeks, it will lead us straight to new highs at the beginning of November.

Following price action in this way allows for preparation. 

Timing, position size and stop levels can be (and must be) planned in advance. Not a recommendation, not financial advice.

The topping formation in biotech has been followed and traded (via BIS and LABD) by this firm since early June. 

Doing so, forces one to be accustomed to the behavior of the sector. 

Behaviors such as counter trend action in IBB, tends to be complete and resume original trend, right around the 10:00 a.m. to 10:30 a.m. time-frame.

That’s a data nugget that can’t be obtained by parachuting into a sector, taking a position and hoping it all works out.

A perfect (short) trade set-up would be for price to gap-higher into the 2nd, or 3rd (November) and allow for an entry with a well defined stop … such as the top of the gap-bar.

Of course, at the open this Monday, IBB could break the trend-line and create an alternate scenario … anything can happen.

However, at this point, probabilities and momentum (although waning) favor continuation upward.

Charts by StockCharts

Note:  Posts on this site are for education purposes only.  They provide one firm’s insight on the markets.  Not investment advice.  See additional disclaimer here.

Break & Test: Biotech

Getting out of a non-performing position allows the mind to clear.

What we see now, is a massive terminating wedge pattern for IBB. 

That wedge had a trend line break September 3rd, on decisive volume.

The break is now being tested.  This is typical market behavior. Expandable chart of IBB, is here

It’s about thirty minutes before the open and pre-market activity shows IBB trading higher. 

The IBB, 50% retrace level is approximately ~ 136.20

IBB tends to move counter-trend during the first two hours of trade. 

If the trend is down and the market’s just testing, the (continuation) reversal lower may come around 11:30 a.m. EST.

Inverse funds (not advice, not a recommendation) are BIS (2X-inverse) and LABD (3X-inverse).

Charts by StockCharts

Note:  Posts on this site are for education purposes only.  They provide one firm’s insight on the markets.  Not investment advice.  See additional disclaimer here.