Edge of The Lake

The late David Weis, instructed his students during a 2007, trader’s camp sponsored by Dr. Elder, that ‘trades are found at the edge of the lake’.

Most of the training session was recorded and reproduced on DVD. That video is still available, linked here and is a wealth of knowledge.

Within the video, Weis analyzes what he calls ‘The Apache Spring’.

No, it’s not a history lesson of Chato’s raids in New Mexico Territory during the spring of 1882; it’s an analysis of Apache Oil, ticker APA.

That analysis alone, should be enough to convince any rational person, price action has absolutely nothing to do with any fundamentals.

Wyckoff repeated this assessment in his autobiography; ‘prices have an energy of their own.’

Prices are manipulated. They always have been; but it’s not important to know who’s doing the manipulating.

What’s important, is to discern (within probability) the objective of the manipulation.

Which brings us to Oil & Gas, XOP.

We’re at the edge of the lake.

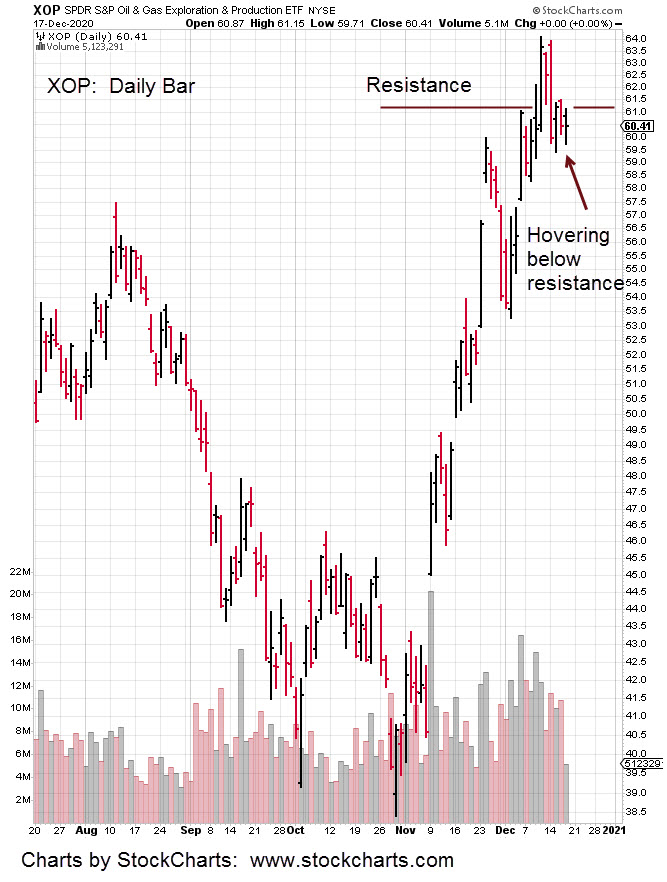
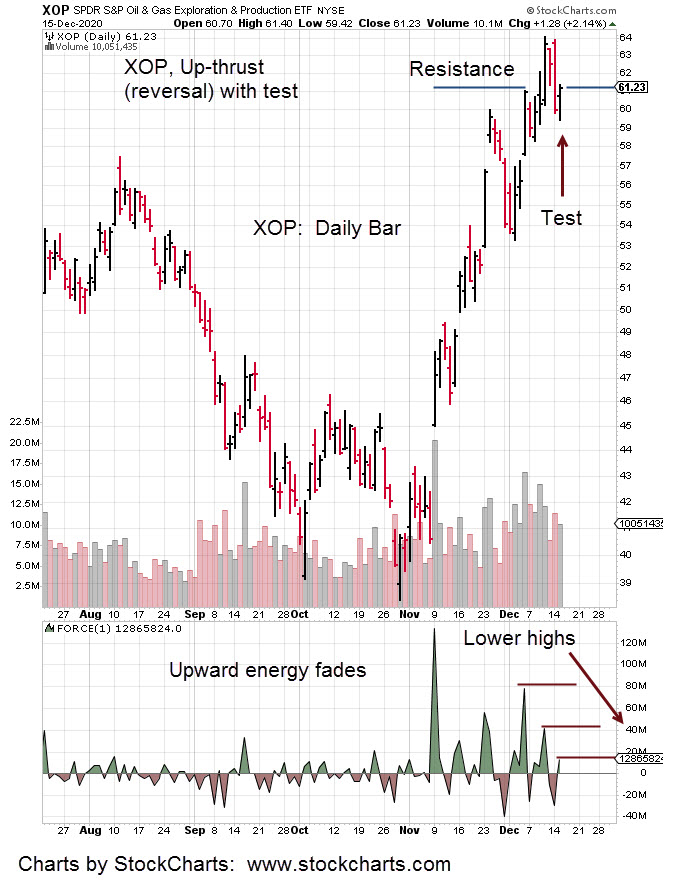
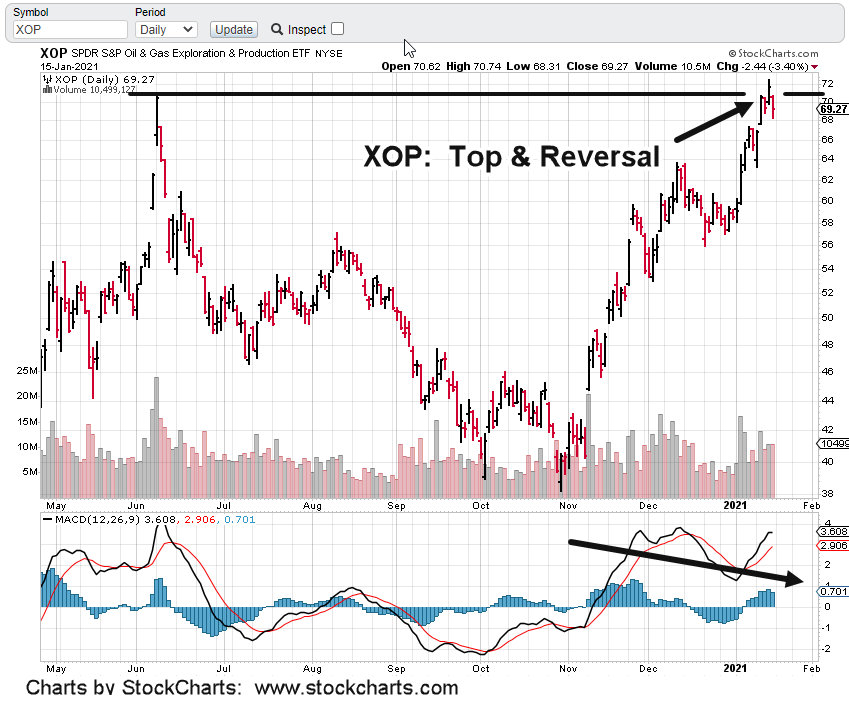
Up-volume is declining and momentum (MACD) has bearishly diverged. If there’s to be a sustained reversal, this location is high probability.

Price action in XOP, is attempting to close the reversal gap. This morning’s pre-market shows it might do that in today’s session.

We’re already short the sector via DUG (not advice, not a recommendation) and watching carefully for gap closure with subsequent continuation of the nascent reversal.

Charts by StockCharts
Note:  Posts on this site are for education purposes only.  They provide one firm’s insight on the markets.  Not investment advice.  See additional disclaimer here.

The Day After: XOP Reversal

Last Thursday, the day the XOP report was posted, it topped.

The day after, Friday, it reversed.

XOP opened gap-lower and inverse fund DUG opened gap-higher.

Sometimes, it’s that simple. Went short the the sector (not advice, not a recommendation) at DUG 21.5899

Charts by StockCharts

Note:  Posts on this site are for education purposes only.  They provide one firm’s insight on the markets.  Not investment advice.  See additional disclaimer here.

Removing The Risk: Oil & Gas

The dollar and bonds have reversed.

Yesterday, oil futures posted a downward reversal bar. This morning’s (pre-market) session is lower again by about 1.00%.

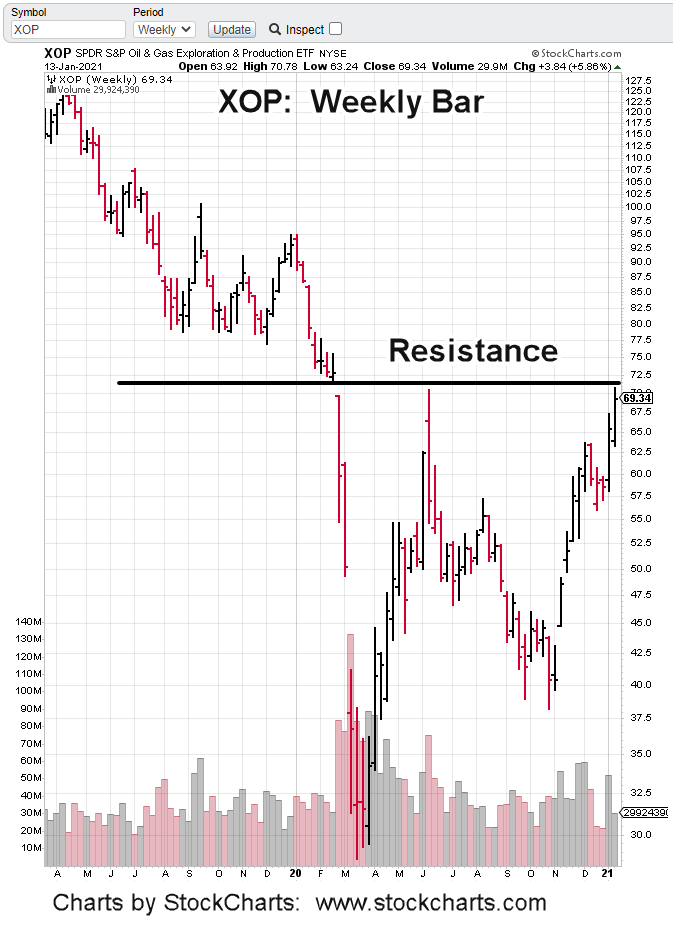
Longer term perspective (above), Oil & Gas Sector, XOP is at resistance.

Shorter term, the daily (below) posted a measured move off the wedge formation.

There’s not ever ‘no risk’ in the markets … but there is ‘low risk’.

That’s where we are now with XOP. Risk is low the up-trend will continue unabated.

To get past long-term resistance, (if it’s going to do so), XOP may have to come back and retrace for fuel.

With unemployment claims just out at 965,000 does anyone really think the economy’s going to bounce back?

Back in the day during a real (not contrived) recession, it was bad when unemployment claims hit around 385,000. Those were the days.

One of the Inverse funds for XOP that’s fairly liquid (not advice, not a recommendation) is DUG.

Stay Tuned

Charts by StockCharts

Note:  Posts on this site are for education purposes only.  They provide one firm’s insight on the markets.  Not investment advice.  See additional disclaimer here.

Dollar Reversal

If the dollar (UUP) keeps going, its trend-line’s rising at a stiff 65%, annualized.

Sectors like Oil & Gas, which have essentially been a ‘dollar-short’ theme are at risk of significant reversal.

That’s in addition to anecdotal data from Van Metre’s updates, the oil patch is awash with inventory.

XOP is a good proxy for the long side and DUG for going short (not advice, not a recommendation).

Charts by StockCharts

Note:  Posts on this site are for education purposes only.  They provide one firm’s insight on the markets.  Not investment advice.  See additional disclaimer here.

Failed Moves

There’s nothing more dramatic and profitable than a failed move.

The controlling party, bulls or bears push the market in their direction; only to find out, there’re out of fuel.

The opposing side has been gathering forces to mount an offensive.

Perhaps the most famous ‘gathering of forces’ was the failure of Long Term Capital Management.

If memory serves correctly, it was Goldman Sachs that found out LTCM was over leveraged and overextended.

They used that data for their benefit.

That’s not to say the failed move in the Oil & Gas Exploration (XOP) market is anywhere near the LTCM level.  Just saying, markets are fractal and failed moves occur on all time frames.

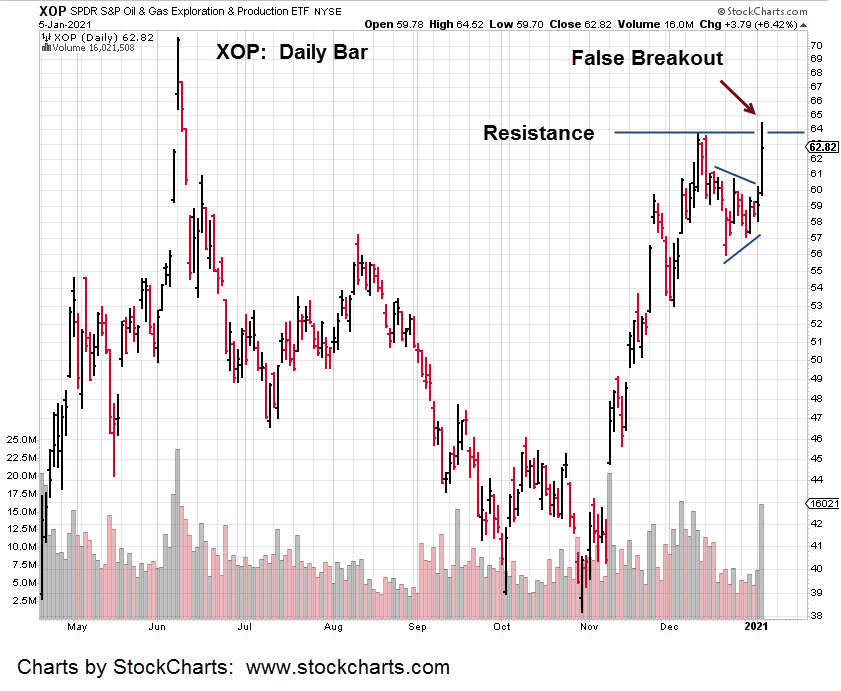
The daily chart of XOP shows the failed attempt to break above resistance. 

Price action was swift in the early session; then stalled at mid-day and retreated quickly into the close.

That retreat brought price below resistance … indicating significant weakness.

The short position in biotech (via BIS) was profitable but it did not have the potential for swift action like shorting XOP.

Since the firm follows the tenets of Gerald M. Loeb (late Vice Chairman of E.F. Hutton), we do not diversify.

Trades are focused on specific price action; therefore, tend to be concentrated only in one or two markets at any time.

We know from a fundamental standpoint, there’s no (or very little) demand for oil and the by-products.  Steven Van Metre has contacts in the field that are feeding him information on what’s really going on.

While some of the minions that watch his updates complain about the colors of his moving averages, we’re more interested in the anecdotal data such as ‘oil inventories are piling up’.

Even better was the comment (a few weeks back) that EIA data is not telling the whole story.  There’s even more oil than what’s in the report.

That’s our backdrop for shorting the XOP by using DUG.  Not advice, not a recommendation.

Recall that DUG, with regards to the firm’s broker, has stated “not marginable” indicating especially high volatility.

Open positions are below:

Charts by StockCharts

Note:  Posts on this site are for education purposes only.  They provide one firm’s insight on the markets.  Not investment advice.  See additional disclaimer here.

Strategic Position

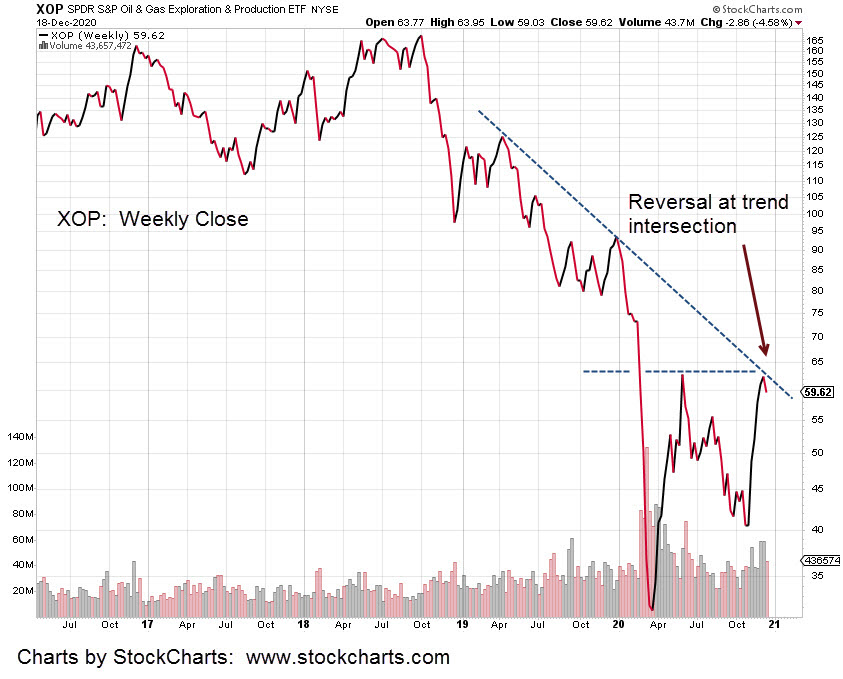
Last Monday’s update on the Oil & Gas sector ETF, showed it at a confluence of trend-line resistance.

Short positions had been established during that week (on 12/8 and 12/9) using inverse fund DUG; not advice, not a recommendation

Now, we see confirmation of the confluence.

XOP reversed right at trend intersection. 

Doing so, validates those resistance areas.

If the XOP reversal continues, next step is maintain short while determining the market’s own time frame for decline.

That means going through charts of XOP, selecting Daily, 2-Day, 3-Day charts and so on, until the best price action correlation to time, is observed.

The last major down-leg in XOP, lasting from January 8th to March 19th was best represented using a 7-Day chart.

Setting stops on the way down (DUG up) using the 7-Day, would have allowed the majority of the move to be captured.

Low-to-high on DUG from January 8th to March 19th, was 37.48 – 184.95; a gain over 393%.

Stay Tuned

Charts by StockCharts

Note:  Posts on this site are for education purposes only.  They provide one firm’s insight on the markets.  Not investment advice.  See additional disclaimer here.

XOP, The Place To Be … Short

The dollar’s at multi-year lows. 

Oil reaches new recovery highs along with S&P, Nasdaq.

So, what does XOP, do?  Nothing.

Price action ended essentially unchanged.

The positive market bias along with extremes in opposite directions for the dollar and oil should have done something, right?

“Should” is a word never to use in any market analysis.  What ‘should’ happen rarely happens and usually, it’s the opposite.

XOP reached its high last week at the same time huge volume was moving into the inverse fund, DUG.

This week, is lower XOP action that looks about ready to roll over.

The market itself has shown where to go for the short side.  It’s the one sector that appears ready to move lower.

The position in DUG is being maintained (not advice, not a recommendation).  Because of today’s tight action, the stop remains at DUG 24.72.

Charts by StockCharts

Note:  Posts on this site are for education purposes only.  They provide one firm’s insight on the markets.  Not investment advice.  See additional disclaimer here.

‘Downward Pressure’

That’s part of the title from the Energy Sector report, linked here.

Those exact words were used just hours prior, in the pre-market update. 

“Downward pressure is increasing.”

The short position in the sector is being maintained via DUG (not advice, not a recommendation).

The stop is set to be moved after today, based on price action.

Using USO as the proxy, oil is pushing a little higher as of this report (12:41 p.m., EST) probably because the dollar’s probing new lows.

Even though the dollar’s at lows, action thus far is reversal. A UUP close above 24.38, may signal trouble for those that are short.

The markets continue to be stretched to extremes.  Based on data thus far, Energy Sector appears to be reversing (again) first.

Since that sector’s in a long term down-trend, XOP reaching its highs way back in June of 2014, we’ll remain focused on DUG.

Note:  Posts on this site are for education purposes only.  They provide one firm’s insight on the markets.  Not investment advice.  See additional disclaimer here.

Oil & Gas: Power Down

Thrust energy in Oil & Gas sector XOP, continues to erode.

The weekly chart of XOP, has the longer term view … including the confluence of trend-lines; another factor.

Now on the daily, it too is losing power.  Force Index (bottom of chart) has successive lower highs and on Monday, a lower low as well. 

Downward pressure is increasing.

The EIA report is released at 10:30 a.m. EST. We’ll see if there’s another inventory build.

The firm is currently short this market via DUG (not advice not a recommendation). Hard stop: DUG, 24.72

There’s some level of protection (against volatility) with DUG reaching an apparent low last week and XOP making its high.

Moving on to Gold:  GLD, GDX, DUST

Pre-market shows gold flat and the miners (GDX) trading slightly higher; still on track to the target in this update.

If and when targets are reached, we’ll assess whether or not a low risk (short) position is available via DUST.

Charts by StockCharts

Note:  Posts on this site are for education purposes only.  They provide one firm’s insight on the markets.  Not investment advice.  See additional disclaimer here.

The Verdict Is In: Reversal

The first hour is over:  XOP (Oil & Gas) posted a new daily low.

Correspondingly, inverse fund DUG has posted a new daily high.

This is now, potentially a very dangerous juncture in the markets. 

The firm is fully positioned (not advice, not a recommendation) in DUG. 

Wyckoff analysis directives concerning bear markets, were used to identify (at this point) the single position.

More specifically, those directives are to identify the weakest market(s) not the strongest.

It’s the weak markets that will go down farther and faster during mark-downs (or bear phases).

Through a process of iteration (lasting months) as detailed in these updates, the weakest market up to now, has been identified and short positions opened via DUG.

Based on today’s action thus far, we have a hard stop in DUG which is the session low:  DUG @ 24.727.

It’s unlikely price action will return and penetrate that (24.72) low.

The firm uses trading tenets from three market masters as detailed here. 

There are essentially two main tenets from the late Gerald M. Loeb (former Vice Chairman of E. F. Hutton) and those are:

First: 

Significant market opportunities are rare.  When one is identified, use it to its maximum extent.

Second: 

Do not diversify.  Diversification is for those who don’t understand market behavior.  Diversification is for the average … the mediocre.

That last admonition is harsh indeed. However, it’s backed by evidence from the top traders.  Over and over we see their positions (detailed in the press after the fact) were highly concentrated.

Of course, none of the above is a recommendation. 

In the next instant there could be an event which completely turns around the oil sector’s fundamentals … like a major earthquake taking out millions of barrels of supply.

As we have seen with seismic activity increasing dramatically, that scenario is not too far fetched.

At this point, we’re positioned in DUG.  Hard stop, DUG 24.73

Stay Tuned

Charts by StockCharts

Note:  Posts on this site are for education purposes only.  They provide one firm’s insight on the markets.  Not investment advice.  See additional disclaimer here.