That’s according to this episode from the Keiser Report.

Before we address that ‘report’, first this:
The video at this link (until it gets removed) is only 3:37 minutes long … but it explains everything.
It’s a well orchestrated script.
How else would every single major corporation have exactly the same advertisements?
Exactly the same; Literally, word-for-word.
So, bitcoin to replace gold? … it’s not even necessary to waste time with an answer. The deeper question is, what’s really going on with gold?
Gold is part of the script as well:
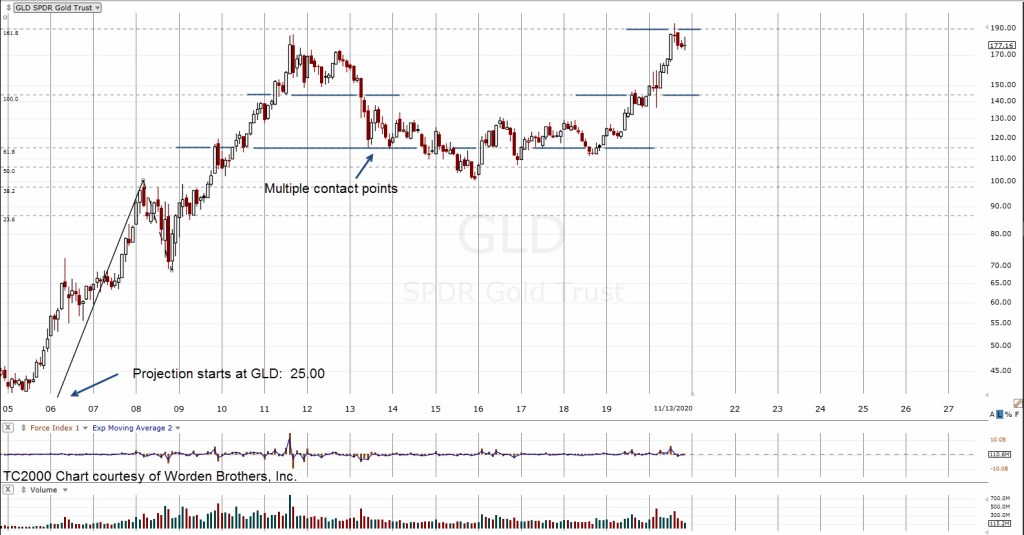
Gold is subdividing lower at this juncture.
One target level from this update puts it around the $1,300-area. By that time and if it gets there, the objective is met.
There will be few-to-none of the original bulls left to buy in … their money gone; used to pay bills, buy food or worse … bitcoin … right in time for a major solar flare to knock out the entire electronic grid.
Listen to the “Report” and how the big names are bandied about. They have the big bucks … you don’t. So, listen to them. They are the elite.
No, they are part of (and always have been) the coordinated effort to subjugate the masses.
It’s just now, there are enough ‘asleep’ with huge numbers of the population flu-shotted, vaccinated, fluoridated, medicated into complete stupidity; or just too afraid of the truth.
It’s not necessary to hide the message. What are you going to do … “elect” someone to change it? Got that one covered.
If you have read this far … yours is a different story. Welcome to reality.
One part of that reality is the markets are a wealth-transfer process which is now in overdrive.
Looking at the daily newsfeeds, it’s obvious (or should be) to the old-timers, the lies and miss-direction have gone to a whole new level.
Wyckoff’s admonition about listening to the news is more true now than a century ago.
Ignoring those news-feeds and focusing on price action, the initial analysis of gold and the miners from late October, was spot on.
The beginning trade in this series was a short position (via JDST) entered on Friday November 6th, when gold was at intermediate highs.
That short was held over a tense weekend.
Going against hundreds of thousands if not millions (on the other side of the trade) is difficult indeed.
Robert Prechter in his writings has detailed how hard it is to override the limbic (herd) system of the brain and operate separate from the crowd; nearly impossible.
By late Sunday – early Monday, gold futures (GCZ20) had collapsed.
The trade was closed out on November 9th, with a solid 13.22% gain.
Recognizing that JDST had more downward bias error than DUST, the next short position was initiated on the senior index (not advice, not a recommendation).
The GDX chart below (expandable version here) shows it’s following Fibonacci projections lower.
It would be nice from a profit stand-point for GDX to reach all the way to the 16-area (blue oval).

Even Steven Van Metre has indicated several times in his reports, this area is his target as well.
After all, who is going to listen to some guy whose wife made his “Like” and “Subscribe” flash-cards from cardboard and sticks?
Stay Tuned
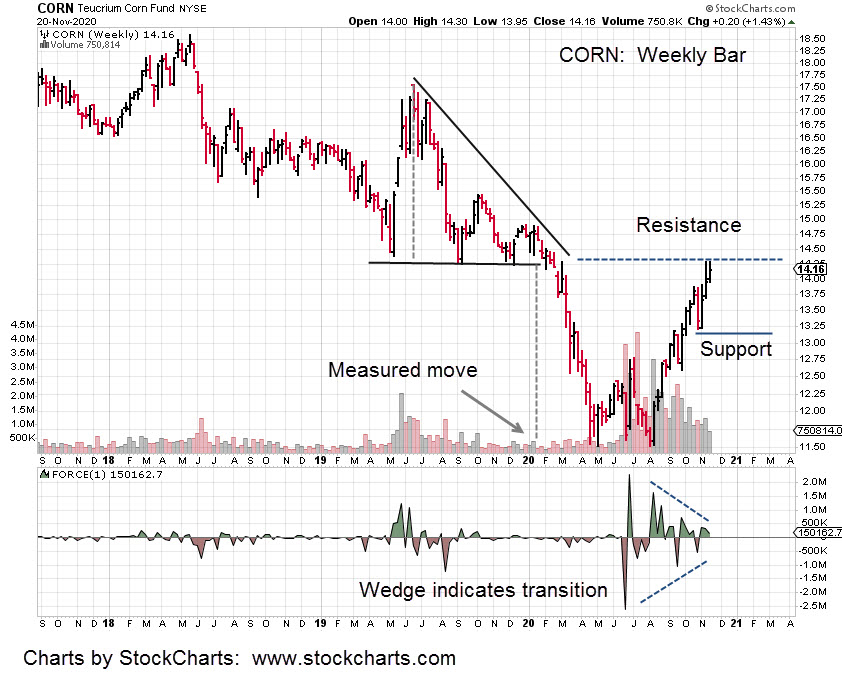
Charts by StockCharts