Deflationary impulse is a term that is used to describe the potential decline in gold and silver prices.
If that’s what’s coming, it looks like it’s already started.
The weekly chart of GLD below, shows the long-term action in the sector.
We have a trading range that formed during 2013 – 2019. That range gave a projected ‘measured move’, to the 185-area for GLD.
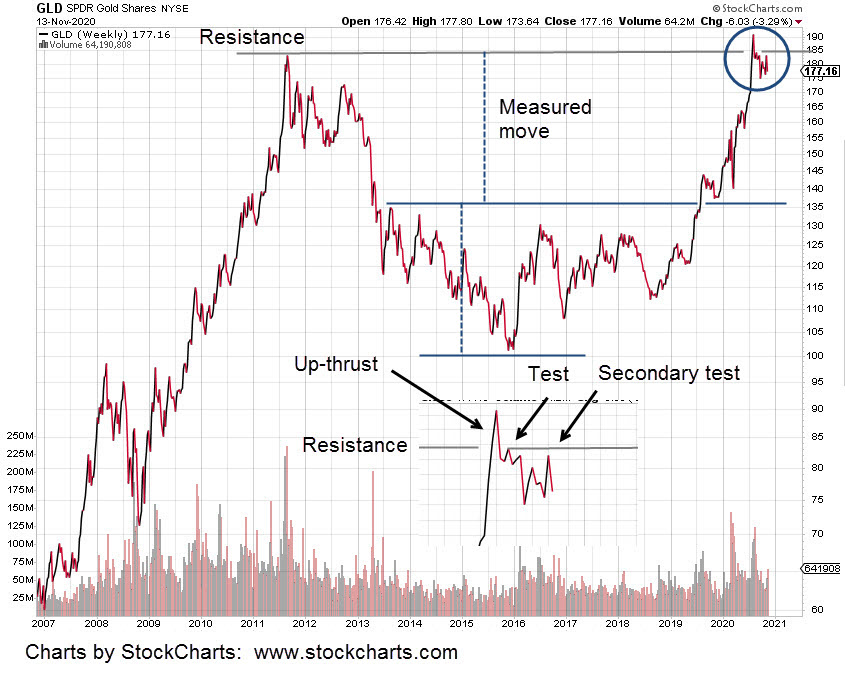
The target has been met. The bullish trade is over and now something else is being created.
That something from the circled area shown, expanded at the bottom of the chart, appears to be a reversal (Wyckoff up-thrust) condition.
The up-thrust was tested early in the reversal (first arrow) and this past week looks like a secondary test. Secondary tests do happen. Not too often but its acceptable market behavior.
In the updates here and here, the overnight futures price action was used to determine this past Friday, 13th, was a 38% retrace of the most recent down move; indicating weakness.
Anything can happen. GLD could open higher on Monday and somehow power its way through the down-trend line shown in Friday’s update.
However, probabilities based on the combined analysis point to continued downside action.
If we get a decline, how far would it go?
Price action permitting, we’ll cover downside targets in the Monday pre-market update.
Charts by StockCharts