Truth comes only to those who actively seek it.

This site works to present truth as background or ‘macro’ as it were and then look for price action set-ups correlating with truth.
It turns out (as some may have suspected) the ‘inflation’ narrative is a myth. It’s just another lie that’s being perpetrated by the powers that be (TPTB).
According to Jeff Snider and Steven Van Metre, at time stamp 21:30, there’s no way TPTB are going to correct the public’s perception that hyperinflation is right around the corner.
It serves their purpose to have the masses in complete delusion … always setting up on the wrong side of the trade.
Using price action itself, problems with the hyperinflation narrative were presented in this update.
Gold is near all time highs. However, Junior Mining Index, GDXJ, and Senior Mining Index, GDX are far below their previous highs. The junior’s are the weakest and so that’s been the focus.
In a bear market, focus on the weak sectors.
No doubt, there are a lot of well respected traders, analysts, YouTuber’s that are on the bullish side of the market. Here are just some examples, here, here, and here.
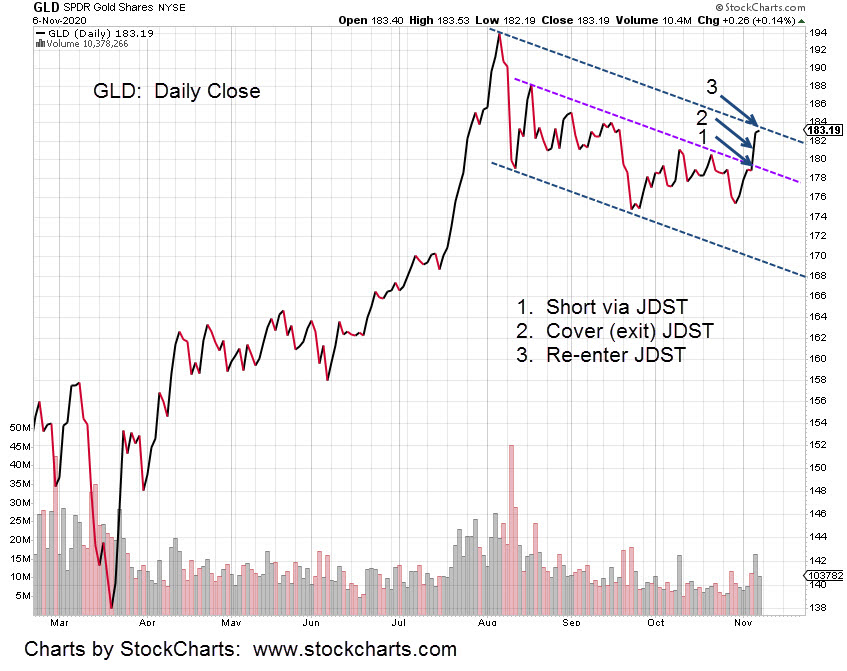
So, at this juncture, this firm is taking the opposite side of the trade with its re-established position in JDST.
Hard stop in the market GTC, is at 8.82 (not advice, not a recommendation).
If stopped out, we’ll reassess and determine if another entry is warranted.
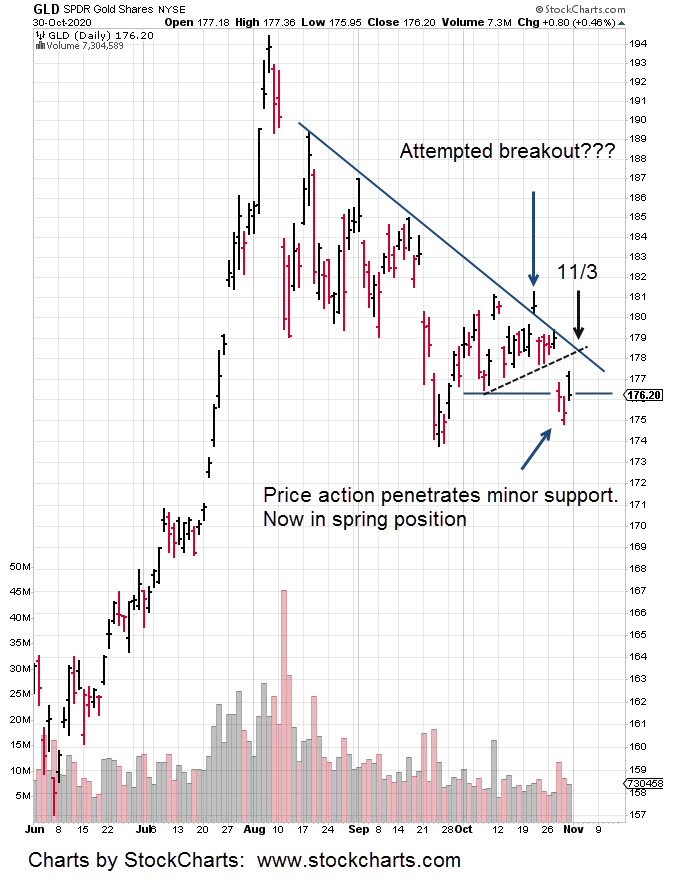
Even if the trade proves to be wrong, it’s a low probability that price action will break out of the GLD trading channel shown (below) in just one attempt.
Typically, price action needs to retrace (lower) to gain enough fuel for a breakout.
If the retrace occurs, it will put the JDST position in profit with the miners down accordingly. Doing so gives the ability to analyze the situation with objectivity.
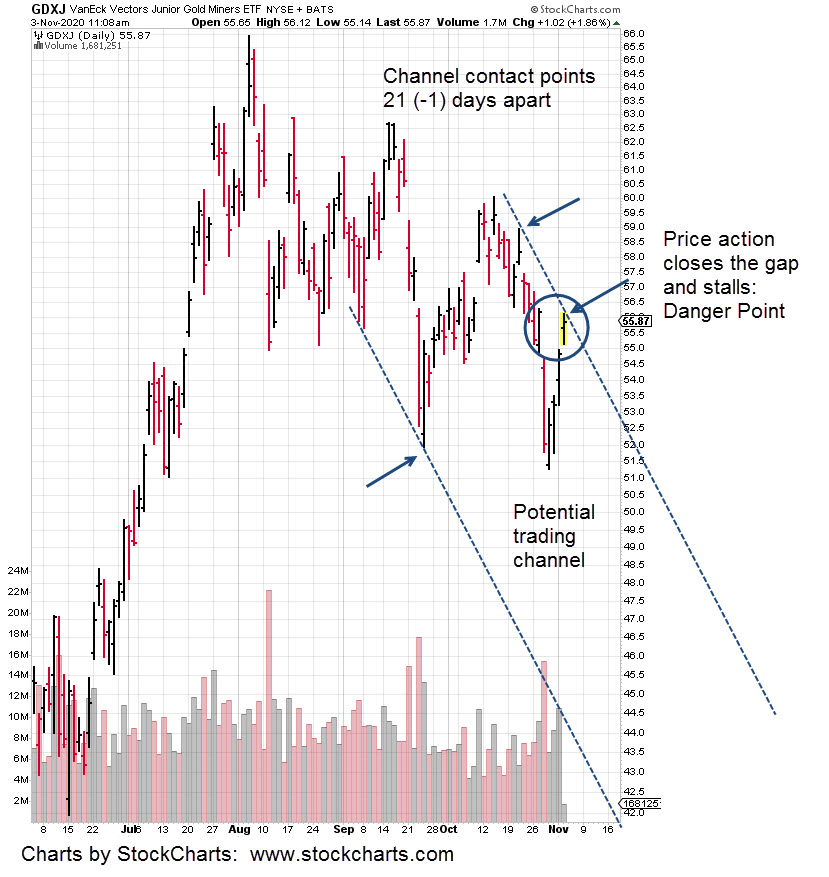
We’re looking for a swing lower to the bottom of the trading range (at a minimum) for GDXJ. Just a few of the empirical and technical conditions that favor such a move are listed:
Price action (GDXJ) finished at the high of its recent trading range and resistance. It thus created a Wyckoff up-thrust, reversal condition.
The GDXJ move over the past week generated a wide, high volume price bar. Such areas tend to be tested (retraced) by the market.
GDXJ finished at a high on a Friday. Monday’s are typically down or a retrace day.
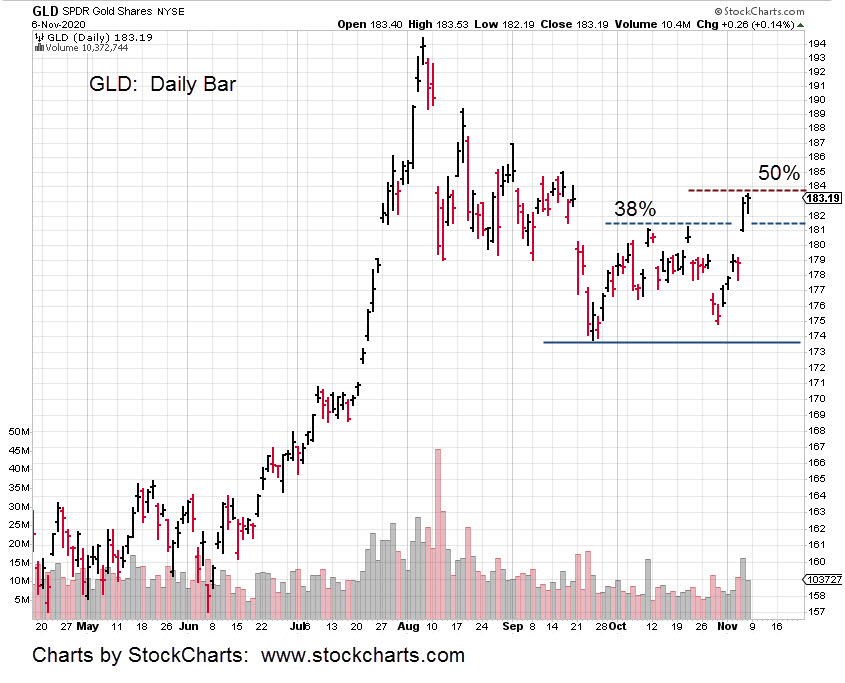
Gold retraced up to its own 50% level and has contacted the right side of a down-trend line. Lower price action in the coming week is expected.
The dollar has its own reversal set-up in progress.
Dollar, UUP price action penetrated minor support (Wyckoff spring, reversal condition) and is close to a major support level.
Dollar up, gold down.
In summary are two charts of GLD and one of GDXJ, below:

Charts by StockCharts