Back in the day, Livermore talked about how he established positions for a directional move … a move that would last days, weeks, or longer.

In his fictionalized biography, Reminisces of a Stock Operator he said words to the effect, take a full size position early; then leave it alone.
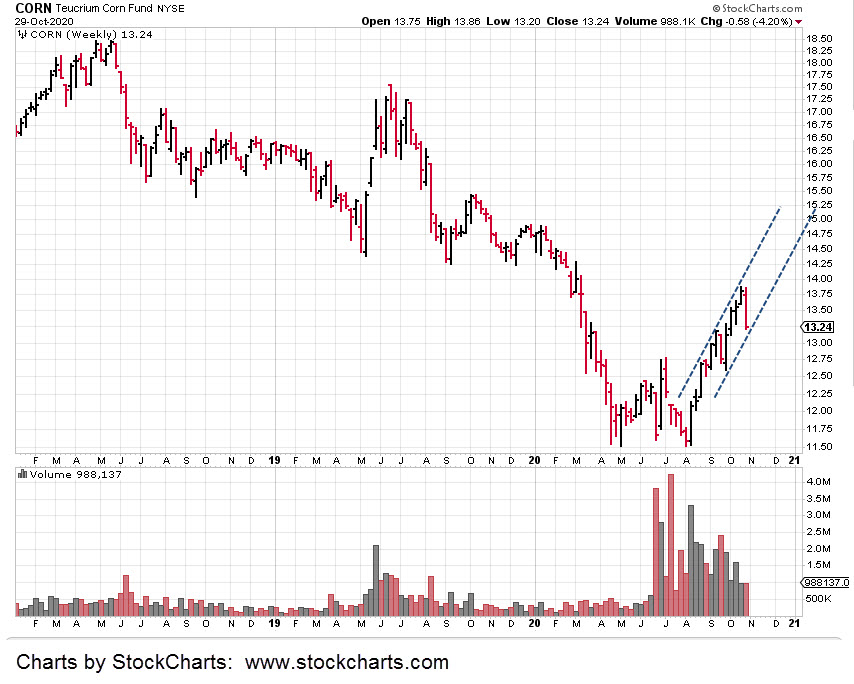
We are at the danger point for CORN make no mistake. Price action penetrated previous well established support and stopped dead.

Our initial position (not a recommendation, not advice) was entered about seven minutes before the close on Thursday. Doing so, gave an entry that was just 0.04 points from the lows of the day.
The expectation for today’s session was for prices to rise immediately; which they did.
During this session, the initial position was increased by 50% (pyramiding) and the stop left (around 10.10 – 10.18) for now.
The risk of course, is what happens when the crop report is released just at the close on Monday.
It’s not what’s in the report that’s important. It’s the ‘excuse’ to move prices around that’s important.
Of course, we could be stopped out beforehand. Anything can happen.
The weekly chart shows a potential trend line and channel. Downward thrust has dissipated when compared to the last weekly move lower (9/25/20).
The only real negative from today’s session; volume was light.
Stay Tuned
Charts by StockCharts