That was Livermore’s adage nearly a century ago. Find conditions for a sustainable move and get in. Then wait and wait some more.
Going on, he states that is was not the thinking that made him money … it was the ‘sitting’.
The short entry on GDX was initiated with DUST (2X Inverse, GDX) at DUST 18.86.
Initial stop (not advice, not a recommendation) was very tight at the session low, DUST 18.45.
Price action the next session (yesterday) pulled away from entry levels and the stop was moved to 18.56.
Today’s pre-market session (8:54 a.m. EST) shows continued downside for GDX, with DUST up correspondingly.
If there’s a higher close in DUST, we’ll move the stop again.
With the overall markets, S&P 500, Dow, NASDAQ, at or near all-time highs, the precious metals sector seems to be leading the way lower.
If the rest of the market reverses, downside action in the mining sector could be dramatic indeed.
In other markets, it appears that Peabody Energy (BTU) may have finally found its low; from top to bottom, a -98.33% decline.
Analysis of BTU to be forthcoming before the end of the week.
Note: Posts on this site are for education purposes only. They provide one firm’s insight on the markets. Not investment advice. See additional disclaimer here.
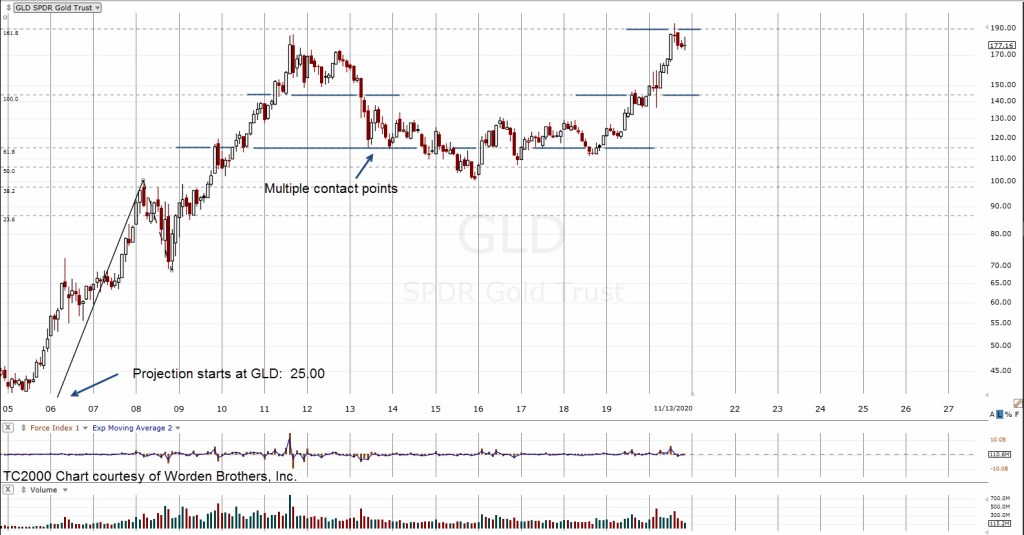
Using that knowledge, we can create a Fibonacci projection tool for the chart of GLD.
The GLD data on the chart does not go back that far. So, we have to improvise.
Taking the Fib projection tool down to the 24 – 25 area of the chart and then identifying a major top of the move during the financial crisis of 2007 – 2008, gives us the chart shown below.
Note the multiple price action contact points on the 61.8 projection. This area is an axis line. The market oscillated around this area for nearly 10-years, before heading on to new all-time highs.
The axis lines and reversal points on the chart provide confirmation we have selected the price action waves correctly.
Using the same 25-area on GLD, we’re gong to remove the projection tool and use the retrace tool and then zoom in using the weekly chart.
That chart is below:
There is a lot going on with this chart. Note the wide, high-volume bar. Volume for that week was about double from the week prior.
Markets tend to go back to these areas for a test.
That area also represents a Fibonacci 38.2% retrace of the entire move off the February 2001, lows.
On top of that, a retrace to GLD 130, is a near exact -33% from the highs.
If that weren’t enough, price action getting to that level would automatically set-up a Wyckoff spring (reversal) condition by penetrating the support area shown.
Will this all happen? Obviously it’s unknown at this point. However, it does give us context.
As always, price action is the final arbiter. We’re short on the GDX, the Major Miners via DUST (not advice, not a recommendation). Our original stop was probably too tight at just 0.41 points from entry.
We’ll see how it works out. Certainly, we are at another danger point.
Stay Tuned
Note: Posts on this site are for education purposes only. They provide one firm’s insight on the markets. Not investment advice. See additional disclaimer here.
Deflationary impulse is a term that is used to describe the potential decline in gold and silver prices.
If that’s what’s coming, it looks like it’s already started.
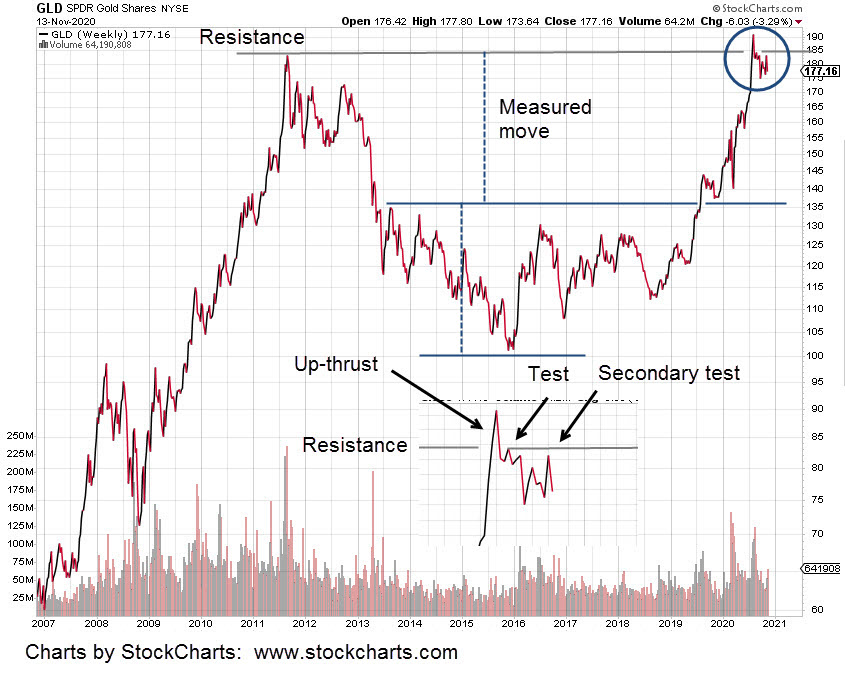
The weekly chart of GLD below, shows the long-term action in the sector.
We have a trading range that formed during 2013 – 2019. That range gave a projected ‘measured move’, to the 185-area for GLD.
The target has been met. The bullish trade is over and now something else is being created.
That something from the circled area shown, expanded at the bottom of the chart, appears to be a reversal (Wyckoff up-thrust) condition.
The up-thrust was tested early in the reversal (first arrow) and this past week looks like a secondary test. Secondary tests do happen. Not too often but its acceptable market behavior.
In the updates here and here, the overnight futures price action was used to determine this past Friday, 13th, was a 38% retrace of the most recent down move; indicating weakness.
Anything can happen. GLD could open higher on Monday and somehow power its way through the down-trend line shown in Friday’s update.
However, probabilities based on the combined analysis point to continued downside action.
If we get a decline, how far would it go?
Price action permitting, we’ll cover downside targets in the Monday pre-market update.
Note: Posts on this site are for education purposes only. They provide one firm’s insight on the markets. Not investment advice. See additional disclaimer here.
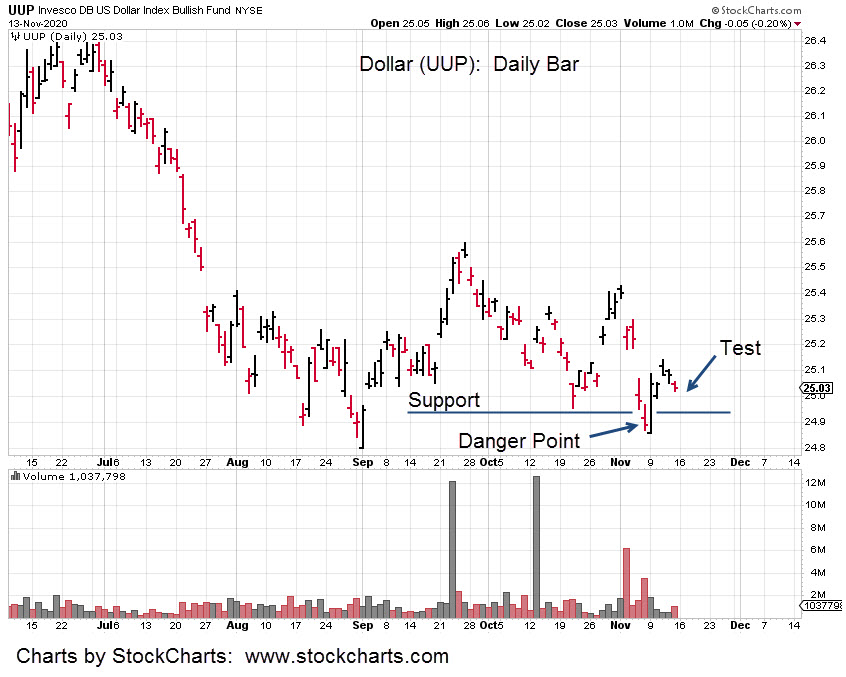
The dollar has reversed and is now testing the lows.
Conversely, when we look at the price action of gold (GLD) its collapse exactly mimics the dollar’s reversal.
Taking into account the futures market activity in gold, it made new daily highs last week during the overnight session, Sunday-to-Monday.
Using that knowledge on GLD, (adding it to price action) it retraced to 38%, of the recent down move this past Friday.
If we’re in a real bona fide reversal of the dollar and gold (posting more confirmation on gold tomorrow), then expectations are for continued gold downside during the coming week.
The dollar, bonds and gold, at this juncture are moving in tandem: Dollar and bonds up, gold (and silver) down.
Note: Posts on this site are for education purposes only. They provide one firm’s insight on the markets. Not investment advice. See additional disclaimer here.
At this juncture (2:40 p.m. EST), price action in GLD has verified the down trend and is pulling away; confirming that last week’s action was a major trap for the bulls.
Although not required by this site as there are no recommendations or advice, as a courtesy housekeeping notes are provided:
The DXD trade was exited at about break-even. Price action is moving too low (DIA higher) for continued maintenance on this trade.
A short position in the mining index GDX (Major Miners), was opened at DUST 18.86, when it bacame obvious that GLD was pulling away from the trend as shown.
Hard stop DUST, 18.45 (not a recommendation, not advice)
Note: Posts on this site are for education purposes only. They provide one firm’s insight on the markets. Not investment advice. See additional disclaimer here.
When a stock market trader starts quoting Revelation, you know it’s bad or about to get that way.
That’s what we have here (time stamp 14:20) where David Dubyne and Bob Kudla discuss a variety of events but mainly, the world’s food supply.
“And I heard a voice in the midst of the four beasts say, A measure of wheat for a penny, and three measures of barley for a penny; and see thou hurt not the oil and the wine.” Revelation 6:6
This site has presented in past updates sufficient data to show the nation’s food supply is being systematically dismantled via at least two avenues.
First:
Naturally occurring disasters are intensified (or outright created) by weather manipulation.
Second:
The planting and harvesting infrastructure is being intentionally disrupted or dismantled by what this site has termed ‘the speck’.
By now, anyone accessing these posts should know what the (imaginary) speck is and it’s even discussed in the above links. The press (financial and mainstream) talk about the speck incessantly.
Put the lie out there long enough and eventually it will become belief.
Back to the markets and more specifically, CORN
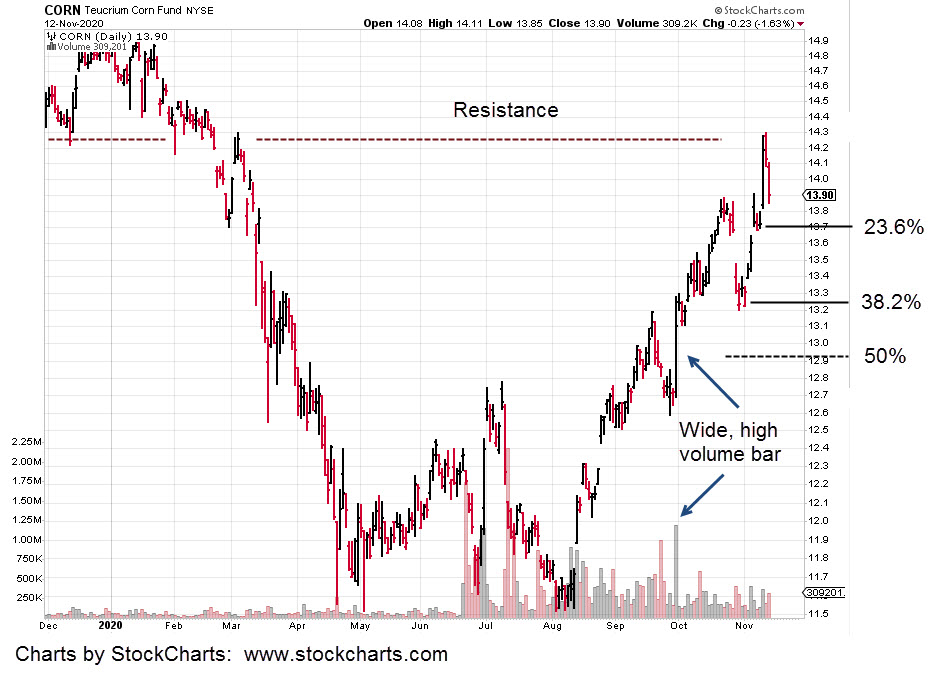
CORN was a trade that was entered by the firm but then decided the look was not right and exited at essentially break-even. That trade was entered right around the area that’s now labeled as a 38% retrace level.
The trade would have been modestly profitable but it’s not what we’re looking for. What we’re looking for may be yet to come.
The 38%, retrace level is now well established support and if penetrated by subsequent price action would generate a reversal condition known as a Wyckoff spring.
Shown on the chart as well, is the wide high-volume price bar that’s right in the middle of the 50%, retrace level.
This is where it gets interesting. Markets behave in such a way as to come back to high volume areas for a test.
If somehow, CORN retraces to this level for a test of the wide bar, it will automatically set-up a spring (reversal) condition by penetrating price action at the 38% level.
Our edge in this situation, are the bullet items discussed above. The entire world’s food supply is in jeopardy. That’s a known fact.
Crops are failing world-wide. Weather patterns are erratic and manipulated.
Knowing this provides a fundamental backdrop that should CORN retrace to test the wide bar, it’s not likely to stay there long.
In addition, if CORN reaches the 50% area, it may never come back to those levels.
Note: Posts on this site are for education purposes only. They provide one firm’s insight on the markets. Not investment advice. See additional disclaimer here.
In the past three days, bonds (TLT) penetrated support and stopped dead.
Anytime a market penetrates support or resistance and halts, it’s an indication that something’s up.
Either the market‘s absorbing transactions at that level to continue on, or it’s a reversal about to happen.
With all that’s known on the short position by the speculators as well as another Van Metre report, bank lending standards, probabilities point toward bond reversal.
The dollar is already reversing higher. Gold has been viciously slammed lower and the overall market’s hovering at all time highs.
The Dow edged lower at the last session. This session in the pre-market (9:01 a.m., EST) it’s lower again at -1.94 points or -0.66%.
If the Dow (DIA) gets below the 290- area, it’s below resistance and another move higher may be difficult indeed.
We’re short the sector via DXD (not advice, not a recommendation). A new daily low for DIA will allow our position’s stop to be moved to DXD 13.49.
Note: Posts on this site are for education purposes only. They provide one firm’s insight on the markets. Not investment advice. See additional disclaimer here.
Note: Posts on this site are for education purposes only. They provide one firm’s insight on the markets. Not investment advice. See additional disclaimer here.
It’s possible during the last session gold (GLD) received a final mortal wound to the hyperinflation argument.
Price action in the December contract (GCZ20) dropped over 100 points in a matter of hours.
A retrace is expected … it’s just part of market behavior.
However, even as gold edges higher, the Junior Miner’s, don’t seem too eager to follow suit.
Price action in GDXJ has risen just slightly with JDST down 0.50% in pre-market.
The dollar (UUP) has reversed as expected. It’s got a long way to go higher for any kind of test on wide, high volume action. Dollar higher, gold typically, lower.
The short position in the Dow (DXD) has retraced somewhat in the early hours.
As it stands now, the retrace is about 1/3rd of the overall gain thus far; perfectly acceptable.
The focus for the firm’s trading at this point is on the Dow and related markets. If the position is increased at these levels (and the analysis proves to be incorrect), it could be stopped out the same day.
So we’ll wait to add … for now.
Separately, it should be noted that every single market assessment in the previous update was correct:
GDXJ in up-thrust reversal condition … check
GDXJ finished at high on Friday, Monday’s typically down … check
Gold retraced to 50%, lower price action expected … check
Dollar in its own reversal set-up … check
Dollar up, gold down … check
All that list means, is at this juncture the markets are being correctly interpreted.
Those interpretations are being done intuitively and without indicators.
Intuition can be skewed by events unrelated to the markets. For now, it’s operating correctly and we’re going to focus on the Dow.
Note: Posts on this site are for education purposes only. They provide one firm’s insight on the markets. Not investment advice. See additional disclaimer here.
Was that it?. Did we see the all time high in the markets, Monday?
The short answer of course, it’s not known.
The longer answer is, to go short the market at this point (Monday’s session) was a low risk entry; not advice, not a recommendation.
The inverse chart of the Dow, DXD (above) shows our initial entry. We’re green at the end of the day and have hard stop, GTC, at 13.32.
Tomorrow’s open could be a gap-lower for the Dow, that spends the rest of the session attempting to retrace higher. If so and depending on the behavior of that price action, it may provide an opportunity to add to the position.
Separately, the gold and related GDXJ, JDST had such sharp moves during Monday’s session that JDST was exited completely and yielded a gain of about 12%.
Gold is likely to retrace higher and possibly offer another low risk (short) position in the miners via JDST.
The trading actions are being directed by the market. It would be nice to have a slower more well behaved situation. However, that’s not the case and the trading response matches the market (price action) dictates.
Note: Posts on this site are for education purposes only. They provide one firm’s insight on the markets. Not investment advice. See additional disclaimer here.