… and that’s when the market is going up!!! What’s going to happen when it goes down with the same (or more) velocity?
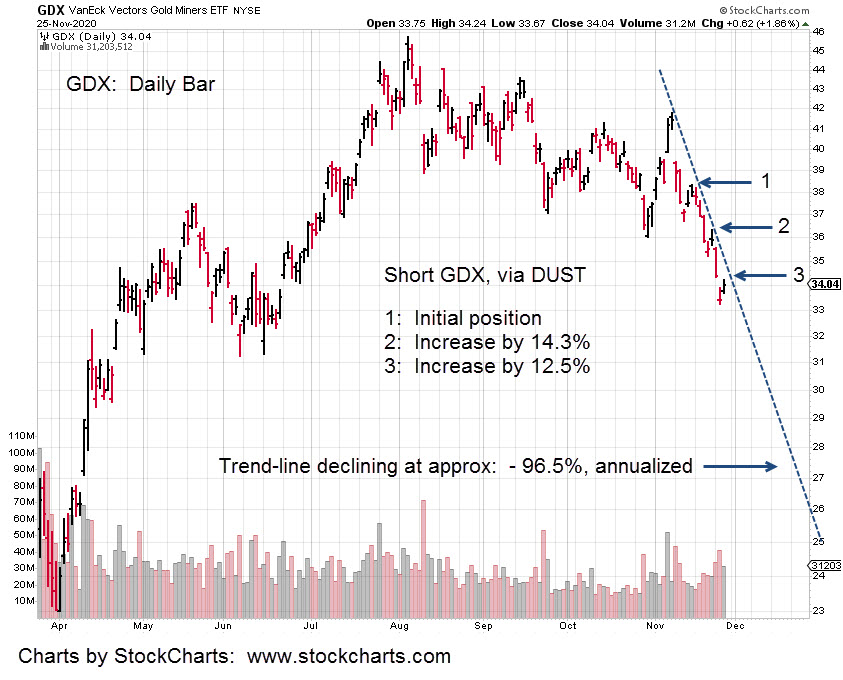
As GDX continues to deflate with very little upside bias thus far, the short position was increased (not advice) on Wednesday.
The chart shows the current trend-line and the short entries (via DUST).
If we are in a real deflationary event, if gold and GDX are leading the way lower, the expectation is for a steady sustained and relentless decline with few if any upward spikes.
Such downward action has been seen before; especially in the oil markets.
The stop for DUST has not been moved (not advice) and is currently at DUST, 21.19.
A new daily low for GDX will allow the stop in DUST to be moved higher.
If the market (S&P, Dow, NASDAQ) opens lower tomorrow, Friday and continues decisively lower, we might add Tuesday, November 24th, 2020, as another empirical data-point for Holiday Turns.
Note: Posts on this site are for education purposes only. They provide one firm’s insight on the markets. Not investment advice. See additional disclaimer here.
Market tops and reversals tend to occur just before, during, or just after a holiday week.
Will this market be any different?
Empirical data collected over the years (linked here) shows a tendency of the markets to reverse during holidays.
The most famous reversal was September 3rd, 1929. That was the day after the Labor Day Weekend.
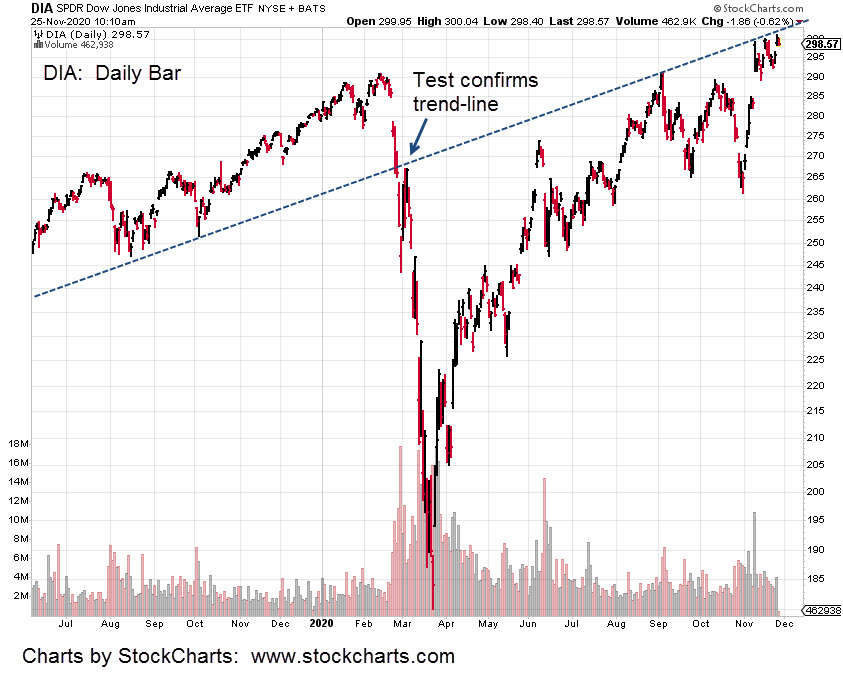
Yesterday, the Dow 30, made a new all time high. Looking at the chart (expandable version here), it’s in a very narrow range and hitting the underside of a long-term trend line.
This is a low risk area. A DXD (2X inverse fund) push past 13.22, could be considered an entry signal; stop at DXD 12.96 (not advice, not a recommendation).
There’s bound to be a lot of chop if and when this market reverses; the firm is leaving this one alone … for now.
Reversal chop was clearly seen on the GDX. It banged around for months before getting into position for a decisive move lower.
Trading inverse funds (for best profit) requires a steady, sustained directional move.
Those moves typically do not appear right at a reversal transition.
If this is it … if this week is the high and reversal for the S&P, Dow and NASDAQ, then it’s likely the market will chop and set up conditions before a sustained move lower.
Note: Posts on this site are for education purposes only. They provide one firm’s insight on the markets. Not investment advice. See additional disclaimer here.
That’s according to this episode from the Keiser Report.
Before we address that ‘report’, first this:
The video at this link (until it gets removed) is only 3:37 minutes long … but it explains everything.
It’s a well orchestrated script.
How else would every single major corporation have exactly the same advertisements?
Exactly the same; Literally, word-for-word.
So, bitcoin to replace gold? … it’s not even necessary to waste time with an answer. The deeper question is, what’s really going on with gold?
Gold is part of the script as well:
Gold is subdividing lower at this juncture.
One target level from this update puts it around the $1,300-area. By that time and if it gets there, the objective is met.
There will be few-to-none of the original bulls left to buy in … their money gone; used to pay bills, buy food or worse … bitcoin … right in time for a major solar flare to knock out the entire electronic grid.
Listen to the “Report” and how the big names are bandied about. They have the big bucks … you don’t. So, listen to them. They are the elite.
No, they are part of (and always have been) the coordinated effort to subjugate the masses.
It’s just now, there are enough ‘asleep’ with huge numbers of the population flu-shotted, vaccinated, fluoridated, medicated into complete stupidity; or just too afraid of the truth.
It’s not necessary to hide the message. What are you going to do … “elect” someone to change it? Got that one covered.
If you have read this far … yours is a different story. Welcome to reality.
One part of that reality is the markets are a wealth-transfer process which is now in overdrive.
Looking at the daily newsfeeds, it’s obvious (or should be) to the old-timers, the lies and miss-direction have gone to a whole new level.
Wyckoff’s admonition about listening to the news is more true now than a century ago.
Ignoring those news-feeds and focusing on price action, the initial analysis of gold and the miners from late October, was spot on.
The beginning trade in this series was a short position (via JDST) entered on Friday November 6th, when gold was at intermediate highs.
That short was held over a tense weekend.
Going against hundreds of thousands if not millions (on the other side of the trade) is difficult indeed.
Robert Prechter in his writings has detailed how hard it is to override the limbic (herd) system of the brain and operate separate from the crowd; nearly impossible.
By late Sunday – early Monday, gold futures (GCZ20) had collapsed.
The trade was closed out on November 9th, with a solid 13.22% gain.
Recognizing that JDST had more downward bias error than DUST, the next short position was initiated on the senior index (not advice, not a recommendation).
The GDX chart below (expandable version here) shows it’s following Fibonacci projections lower.
It would be nice from a profit stand-point for GDX to reach all the way to the 16-area (blue oval).
Even Steven Van Metre has indicated several times in his reports, this area is his target as well.
After all, who is going to listen to some guy whose wife made his “Like” and “Subscribe” flash-cards from cardboard and sticks?
Note: Posts on this site are for education purposes only. They provide one firm’s insight on the markets. Not investment advice. See additional disclaimer here.
It’s full speed ahead with ‘the speck’… well it’s actually ‘Warp Speed’ ahead, isn’t it?
Just what is the definition of ‘warp speed’?This link defines it as traveling faster than the speed of light.
Therefore, if we’re going faster than light, that light can not expose the darkness, the evil. It’s by design.
19 And this is the condemnation, that light is come into the world, and men loved darkness rather than light, because their deeds were evil.
20 For every one that doeth evil hateth the light, neither cometh to the light, lest his deeds should be reproved.
21 But he that doeth truth cometh to the light, that his deeds may be made manifest, that they are wrought in God.
John 13: 19 – 21
By accessing this site, you’re either ‘awake’, about to become awake, or will run away from this site and the battlefield itself.
We’re not on YouTube, not on BitChute or any other video platform … we’re way down on the censorship food chain.
That’s part of the plan.
Stay out of the corporate arena and below the radar.
It’s easy (and low cost) to force a half-million corporate employees to get tested (with false positive) and then subject them to receive the cure.
Tracking down every individual, doing the same, is more difficult and more importantly, much more expensive.
Remember THX-1138? The cost of capturing THX, exceeded the budget allowed. He escapes to freedom.
That’s a long pre-amble to get to the markets at hand … however, it does provide context.
The markets are part of the battlefield.
How else will wealth be confiscated (as is already happening) so the masses are brought to their knees and forced into submission?
Looking at what’s going on while the Thanksgiving, mask on, mask off, and legal proceedings rage, we have the senior gold miners, GDX.
Steven Van Metre, in his Sunday update mentions the GDX at time stamp 7:40, and the dollar at time stamp 14:50. At this point, their movements are counter cyclical.
Currently, at 11:41 a.m., EST, the senior minors, GDX, have broken lower hard … down -3.81% so far.
At this point, it’s now obvious they are heading lower … and fast.
Unfortunately and probably unwittingly, gold bulls and followers that went all-in, positioning long, were played as the useful idiots.
Sure, gold and the miners (if they aren’t nationalized) will rally. Only, it’s likely the herd won’t be part of it.
They could be wiped out by then … their ‘stacks’ of gold and silver used instead to pay mortgages, service margin calls and to buy (real) food.
It’s by design.
What a brutal environment. That’s for sure.
Looking at the chart of GDX, we see the break lower.
It has made a new daily low and thus our stop in the inverse find DUST (not advice, not a recommendation) is moved up to DUST: 20.31.
Gold and the miners are leading the way down. We have executed Wyckoff analysis correctly by identifying the weakest market; the one most susceptible to move lower (first) in a bear market.
Note: Posts on this site are for education purposes only. They provide one firm’s insight on the markets. Not investment advice. See additional disclaimer here.
According to this report from ice age farmer, it’s trash and bugs.
While the sleight of hand is taking place in the political arena, the distraction allows (without notice) some fast food outlets to put garbage, literally, in their food.
Eating real food on a go-forward basis, is going to cost.
If huge numbers of the population are on government assistance, they’ll take whatever they’re given.
According to the link above, that ‘given’, will likely be ‘up-cycled’ food which is trash, garbage, along with ‘insect’ protein.
Those accessing these updates, just by repetition are (or already) getting the picture. There’s a lot more going on than just the markets.
It’s the markets though, that gives us a way (at least for now), to circumvent the cost required to separate from the herd.
Prior updates have discussed the food supply and specifically, corn.
One of those highlighted an area in CORN, that would present an opportunity.
With new restrictions coming or already in place, it’s likely that restaurant dining will take another hit. Winter’s rapidly on the horizon and outside dining will be eliminated for months to come.
Conversely, demand for restaurant ingredients will be affected which in turn, could affect the commodities markets … at least temporarily.
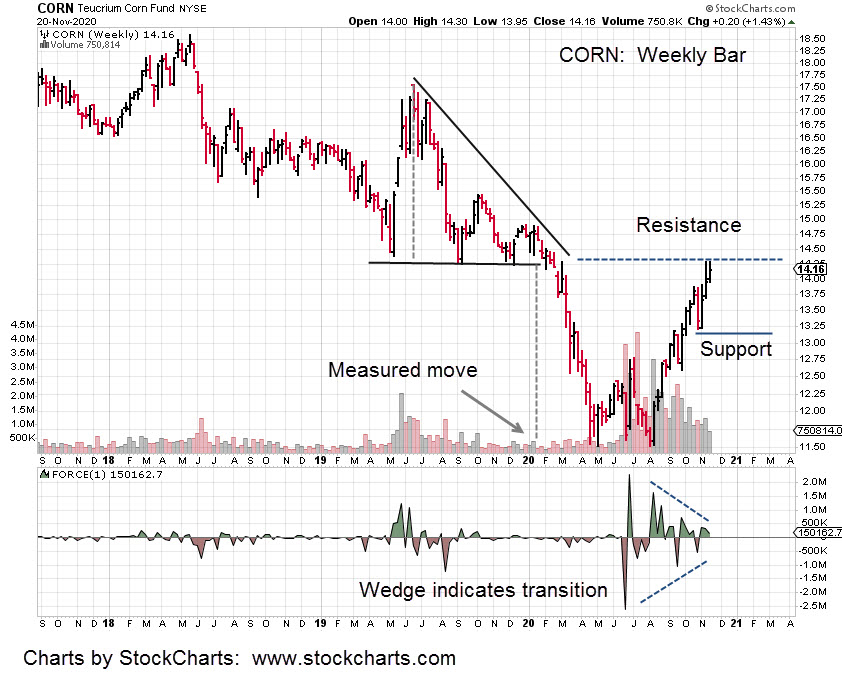
That brings us to CORN.
Even though the CORN fund is an amalgamation of three futures contracts, it’s interesting that it still adheres to classical analysis.
We can see the measured move from the wedge breakout and the retrace back to resistance.
It’s what happens next that’s important.
Restaurant demand could collapse again; driving CORN lower.
If so, and we get below the support area (creating a spring, reversal, condition), it could be the last time … ever, we see these prices.
Note: Posts on this site are for education purposes only. They provide one firm’s insight on the markets. Not investment advice. See additional disclaimer here.
The gold bulls are trapped and the market is eroding away.
The weekly chart of GLD (farther down), shows this past week was the opportunity for GLD to move higher.
It didn’t happen.
Some of the YouTube sites that are monitored, have caught on something’s very wrong with the bullish picture.
However, there are literally millions positioned (or at least thinking) on one side of the trade. Without neural plasticity to switch gears and re-position, at low risk no less, the pain is likely to be severe.
The same goes for the overall market.
Steven Van Metre, in his Friday update stated, ‘retail investors are all-in at the highest level in market history’.
Yet he says, the market did not move significantly higher. That’s the clue. It’s likely we’ve seen the highs.
There’s more middle class destruction on the way with shutdowns and restrictions; all under the guise of the speck.
If the speck is so bad, where are the bodies?
Take a trip to your local graveyard … you’ll probably find the caretaker asleep on his back-hoe … waiting like the Maytag repairman.
There are no bodies except for the odd duffer that died while on a ventilator … ah yes, the ventilator, that topic is for another time.
Those flexible enough, the entrepreneurs, picked up on this scenario long ago and have responded accordingly.
The only way out is self-employment; separate from the crowd. Even that’s no guarantee but at least it provides some time and flexibility.
Getting back to the markets, we see the S&P and Dow at their highs (possibly topping-out) while gold and the miners have already rolled over.
Senior miner index GDX, has now posted an outside down (key reversal) on the monthly chart.
We have one more trading week to go (plus one day), but it’s likely the key reversal will stick.
As always, even with the lower action just passed, upward movement next week (if any) could happen but it’s likely to be halting and laborious.
If the overall markets head lower, the uneducated public once again and by their own actions, have set the stage for their financial destruction.
Only this time, it’s over. There will be no recovery.
As the downturn sets in and jobs continue to disappear, the calls to ‘make it stop’ will become ever so shrill.
The masses will be desperate enough to line up for government assistance and allow (even beg for) the catch … be injected first; No matter who is in office.
There’s a reason, professional, seasoned hard as nails (even profane) market traders are quoting Biblical scripture.
Note: Posts on this site are for education purposes only. They provide one firm’s insight on the markets. Not investment advice. See additional disclaimer here.
There’s a lot going on in the senior mining index, GDX. Price action penetrated support yesterday and set up a spring (reversal) condition.
Today’s action is gap-up open with a test of the support level happening now (10:44 a.m. EST).
The chart shows the down-trend line and contact points.
The magenta, dashed arrow is the location of the initial short position (not advice, not a recommendation) via the inverse fund DUST.
As price action was rising into the morning session (with DUST declining), the short position was increased by about 14%. That area is shown as the orange dashed arrow.
We are looking for the spring action to fail and downtrend to resume.
If GDX closes lower for the day, we’ll move the DUST stop (not advice, not a recommendation) up to its session low; currently at 20.44.
Note: Posts on this site are for education purposes only. They provide one firm’s insight on the markets. Not investment advice. See additional disclaimer here.
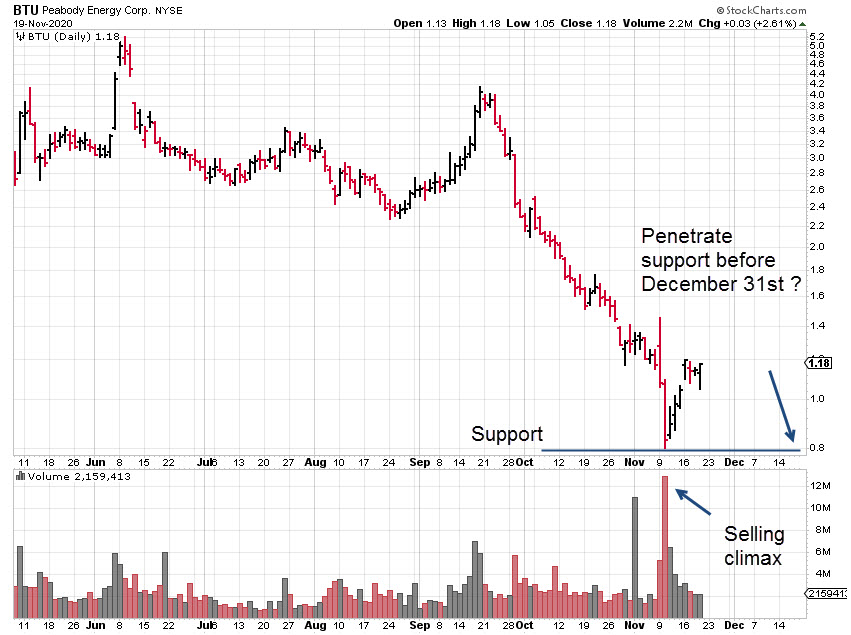
Will BTU go bankrupt before or after December 31st? That seems to be the main question; at least from a SeekingAlpha perspective.
Peabody is in serious trouble, no doubt. It also represents an opportunity as detailed below.
Any stock, equity or index that’s declined throughout the year is subject to “tax loss” selling.
Selling that (typically) takes place during the last week in December and is negated somewhat during the first week of January.
Peabody is now in position to perform according to that scenario
BTU reached its all-time low at just 0.80, on November 10th. If we get Wyckoff bottoming action, (Schematic #1) we’ll have an automatic reaction (happening now) and then a secondary test.
That test could be above or below the recent lows. If the test occurs before December 31st and pushes below 0.80, we have a spring (reversal) set-up.
Once tax loss pressure is released at the beginning of the New Year, expectations would be for a pop to higher levels.
This is not a recommendation but a notification of potential, short term (very short term) opportunity.
On the longer term and even more speculative is what’s taking place from a world-wide perspective. Specifically, we have increased seismic (earthquake) events as well as volcanic activity.
This activity is directly (and has been proven to be) related to grand solar minimum cycles. The largest volcanic eruptions in recorded history occurred during solar minimums.
Mount Tambora erupted with a VEI (Volcanic Explosivity Index) of 7, Super Colossal, during the Maunder (solar) minimum. That eruption was the largest ever recorded by humans.
This is just background information. Certainly it’s unknown if we’ll get the same scenario. However we do have a source that can reliably predict earthquakes and volcanic activity.
His site is here. That is, until he is kicked off YouTube as many have been.
Dutchsinse is his YouTube handle and before anyone scoffs, his work is shaking it up at the USGS; they at one time, requested that he be arrested.
Conversely, he has offered his technique of earthquake forecasting to the USGS. The response was typical. ‘Not interested’.
After watching some of his hour-long updates where he covers seismic and volcanic activity for the entire earth, judge for yourself.
Why is earthquake activity important to a coal mining operation?
If we get a massive VEI 7, type eruption, it will eject huge amounts of ash into the atmosphere. That ash will block out the sun and render any ‘solar power’ ineffective immediately; for months-to-years.
Conversely, natural gas and coal prices could have an instantaneous jump with BTU (if they are still around) moving higher accordingly.
Note: Posts on this site are for education purposes only. They provide one firm’s insight on the markets. Not investment advice. See additional disclaimer here.
One hundred-three years ago, a brief 64-page text was published where a broker at a trading firm analyzed client accounts.
The year was 1915, and the market was at all-time highs. The purpose of the analysis was to see how the active clients fared after a record breaking run-up.
“Like a great majority of our customers, these traders had been bullish on the munition [World War I] and standard industrial stocks during the great speculative boom of that year, and now, with the stocks in which they had been operating up from 15 to 100 points each, their profits were relatively small and their commitments [i.e. margin] larger than at any preceding stage of the movement.”
Basically, these customers were the herd. Profits, if any, were slim and they are all-in at the high … and on margin.
Just five years later, that same market had lost nearly two-thirds of its value and is down over -61%. The book is called One Way Pockets.
Fast forward over one hundred years. We have The Money GPS with this report; Fund inflows at the highest in 20-years and nobody going short. Well, almost nobody.
A huge amount of the population is out of work and most likely relying on the markets to make up the difference. Remember back in the day, when it was bad if there were 350,000 jobless claims?
The middle class is in the midst of destruction and will (when it’s all over) basically be eliminated. It will usher in, ‘neo feudalism’.
It’s not a new idea as Prechter predicted as much nearly twenty years ago.
This backdrop or macro if you will, has produced the sentiment driving the analysis on this site as well as more in-depth technical data on the host firm’s website.
Taking all into account, under the conditions of today, this moment, we’re short the Senior Miners (GDX) using DUST as the trading vehicle (not a recommendation, not advice). The stop has been moved up to DUST 19.58.
Quotes used with permission.
Note: Posts on this site are for education purposes only. They provide one firm’s insight on the markets. Not investment advice. See additional disclaimer here.
Some of them realize the error, get themselves righted and back on the direction of trend. Others, like in one Livermore example (the cotton trade) go bankrupt.
Just to see how big the hyperinflation crowd is, we’ve added up the total number of subscribers to bullish YouTube channels listed in this update.
That list for sure, is a small fraction of bullish ‘content’ available. At a total of 674,000 subscribers, it’s already a huge number. The actual size of all such content is most likely in the millions.
Note the word “content”, is amorphous. It just means ‘there’s something in there’. It does not mean that ‘something’ is of any use.
When reading through the old trading stories, we see the great speculators operated alone. At times, they employed a support staff of ‘board boys’, writing quotes down on the chalk boards but not much else.
If you’re alone, direction changes happen instantly. Changing direction that fast for millions … not a chance.
At this time in the pre-market (9:03, a.m. EST), gold (GLD) is set to open lower with GDX indicating lower as well.
Looking at the chart of GDX, we’ve got a possible trend line.
Such lines make things a bit easier. If there is confirmation on the way down, we maintain the DUST trade (not advice, not a recommendation); until the trend is broken.
Current stop (not advice, not a recommendation) is set at DUST 18.92
Note: Posts on this site are for education purposes only. They provide one firm’s insight on the markets. Not investment advice. See additional disclaimer here.