Will The ‘Wedge’, Close The ‘Spead’

Bonds traded down hard last Friday.
With the reversal now obvious (since the Fed announcement, September 18th), we have the usual suspects putting out ‘content’ (here and here) letting you know what’s already happened.
In Prechter’s book, The Wave Principle of Human Social Behavior, he states, being part of the herd, is hard-wired into the brain.
Therefore, it takes diligent, consistent effort, to go against the mindless (limbic brain) herd if you’re going to make an objective observation.
So, let’s do just that, taking an objective look at the potential effects of the bond reversal.
Bonds (TLT proxy) began its reversal, rates higher, the day before the last Fed announcement.
The IYR, reached its high that Wednesday, 9/18/24.
Real Estate IYR, Weekly
It’s been nearly three years since the all-time high in December, of 2021. The wedge shown below has been just over a year in the making.
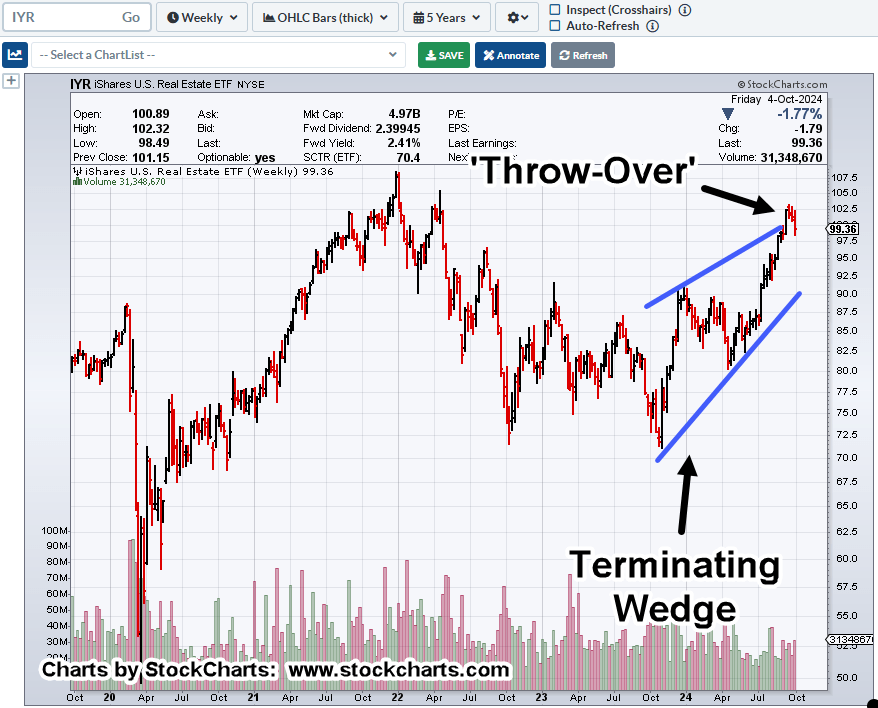
The reversal action of the past few weeks can be seen in the ‘Throw-Over’ area of the chart.
If the wedge has been identified correctly, price action has now entered back into that formation.
Positioning
This post highlighted a short position was on the horizon.
This post confirmed.
This post connected the dots with the bond market.
That same post presented a tentative stop above break even on DRV-24-05 (not advice, not a recommendation).
Trend or Not
We may know as early as tomorrow’s session (Monday), if IYR has established and confirmed a downtrend.
Stay Tuned
Charts by StockCharts
Note: Posts on this site are for education purposes only. They provide one firm’s insight on the markets. Not investment advice. See additional disclaimer here.
The Danger Point®, trade mark: No. 6,505,279
