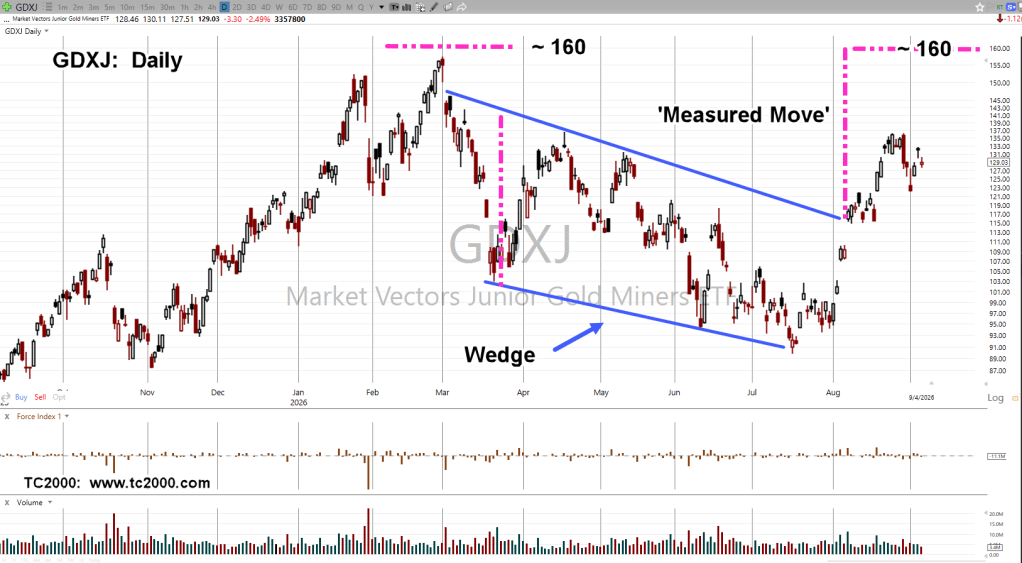
Gold Miner’s ‘Measured Move’

Note:  Posts on this site are for education purposes only.  They provide one firm’s insight on the markets.  Not investment advice.  See additional disclaimer here.

Navigating The A.I., Minefield

Charts by StockCharts

Note:  Posts on this site are for education purposes only.  They provide one firm’s insight on the markets.  Not investment advice.  See additional disclaimer here.

Bonds … The October Surprise

Charts by StockCharts

Note:  Posts on this site are for education purposes only.  They provide one firm’s insight on the markets.  Not investment advice.  See additional disclaimer here.

Lennar … At The Limit?

Charts by StockCharts

Note:  Posts on this site are for education purposes only.  They provide one firm’s insight on the markets.  Not investment advice.  See additional disclaimer here.

The Usual Suspects

Charts by StockCharts

Note:  Posts on this site are for education purposes only.  They provide one firm’s insight on the markets.  Not investment advice.  See additional disclaimer here.

Silver Top … Part II

Charts by StockCharts

Note:  Posts on this site are for education purposes only.  They provide one firm’s insight on the markets.  Not investment advice.  See additional disclaimer here.

The Usual Suspects

Charts by StockCharts

Note:  Posts on this site are for education purposes only.  They provide one firm’s insight on the markets.  Not investment advice.  See additional disclaimer here.

Market ‘Tests’ & ‘Instability’

Taking The Helm

‘We have assumed control …’

For the mining sector we’re about to find out if it’s bulls or bears.

With today’s overall (S&P, Dow, QQQ, etc.) down market and the press screaming in hysterical panic at the start of the day, you’d think the market had collapsed 50% or more.

The last update (over the weekend) had this to say about the S&P (emphasis added):

“So, here we are: The market (SPY) has rallied over the past week, giving the illusion that all is well.

However, it too is now in up-thrust (reversal) position.

So, the SPY declines by just over 1%, everyone loses their head and starts talking about CBDC.

Moving on to the ‘knee-jerk’ sector for the day, let’s look at the miners and specifically GDXJ.

Junior Miners GDXJ, Daily Close

Admittedly, the prior update was unsure whether or not this sector had its up-thrust reversal ‘test’.

Well, now we know.

The chart above has all the Usual Suspects.

We see the spring to up-thrust repeating pattern.

Then, a steady decline from the up-thrust and today’s short-sharp test or as the late David Weis used to call it, a ‘gut check’.

At this point the market’s unstable.

We’ll know soon if somehow we’re on to new highs or if this was the last gasp of a bull move withing an overall, years-long, bear market.

Stay Tuned

Charts by StockCharts

Note:  Posts on this site are for education purposes only.  They provide one firm’s insight on the markets.  Not investment advice.  See additional disclaimer here.

The Danger Point®, trade mark: No. 6,505,279

Real Estate’s Potemkin Village

The ‘Pain Trade’ = Opportunity

‘Some of the best market traders are former Marines.’, Prechter

That’s a paraphrased quote from Robert Prechter Jr., given during an interview in the early 1990s.

The inference: Marines succeed at trading because they have been conditioned to endure and perform while being in pain … physical and mental.

On the other hand, the financial press, being ever so helpful during this unprecedented collapse, is all too happy to help analyze the situation by catastrophizing on how ‘painful’ the market feels.

We’re going to be ‘bathing in lava‘, according to them.

If we go to Jerimiah Babe at time stamp 1:36, the mainstream press is still touting ‘The consumer is strong’.

In other videos, Babe, has shown how devastated the real estate market really is … ‘boots on the ground’ reports at vacant malls, empty parking lots and new (unoccupied) housing developments that stretch for miles.

With that backdrop, let’s look at what the price action of real estate is telling us … is the consumer strong?

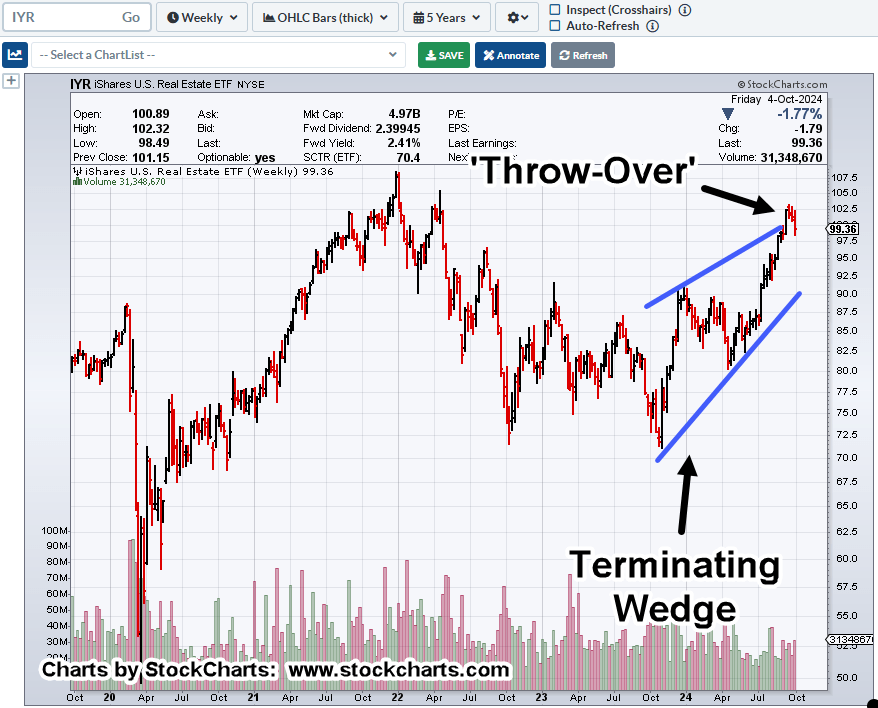
Real Estate IYR, Weekly

There are so many things happening in IYR, it will probably take several updates.

At this point, price action exhibits the following:

Currently in Wyckoff ‘Up-Thrust’ condition, potential reversal

On a close basis, IYR has retraced 38.2% of its entire move.

Repeating trend line(s) underside test.

Trading channel that’s a Fibonacci 34 (-1) weeks wide.

For the week just ended, Force Index is divergent (54.7%, weaker) than the last push higher.

We’ll look at the first three of those, below.

As the market came to a close on Friday, price action pushed through established resistance (and axis line) to end the week higher.

Price action’s in Up-Thrust condition, The Danger Point®

Next, we have on a close basis, a Fibonacci 38.2% retrace as well as testing the underside of a resistance/trend-line.

In the next update, we’ll discuss the possible trading channel and the pressures (Force Index) behind the last move higher.

There Will Be Great ‘Wringing Of Hands’

As always, anything can happen in the markets. The above is not advice or a recommendation.

Next week, we can expect the Usual Suspects to come out and provide their ‘expert analysis’ on what the Fed is likely to do or not.

The Fed on the other hand, has repeatedly said what’s it’s going to do; that is, raise rates.

Interest rate sensitive real estate already appears ready for reversal.

Let’s see what happens. next.

Stay Tuned

Charts by StockCharts

Note:  Posts on this site are for education purposes only.  They provide one firm’s insight on the markets.  Not investment advice.  See additional disclaimer here.

The Danger Point®, trade mark: No. 6,505,279
Biotech … Breakout or Breakdown

The Usual Suspects

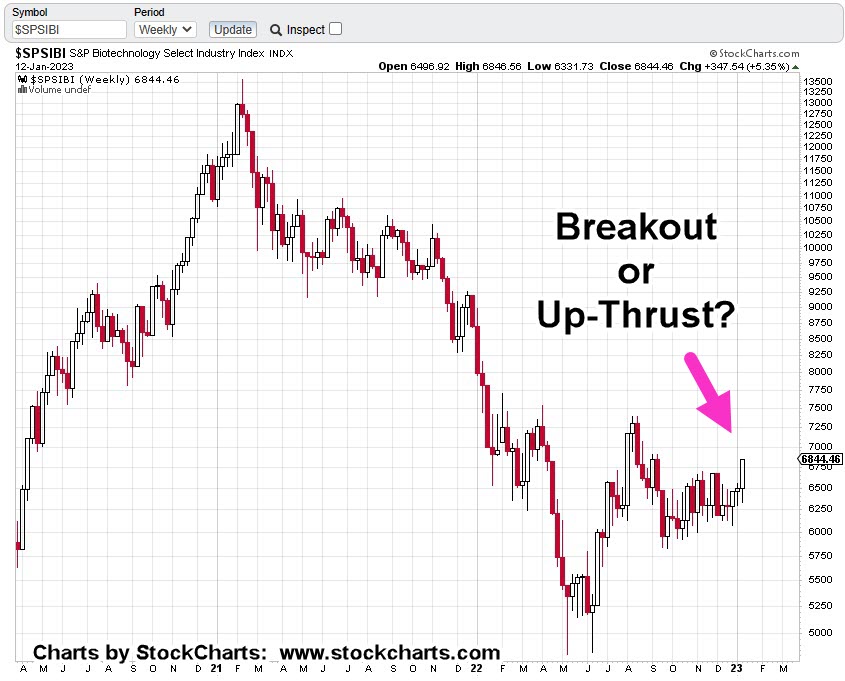
During the past three months, biotech index SPBIO, has been oscillating, coiling like a spring; preparing for a dramatic move.

Then yesterday (Thursday), there’s an upside launch.

We now have price action instability; either the bulls or the bears are in control.

At this point, we don’t know who has the upper hand.

However, based on the list of recent news items below, it does not look good for the bulls.

Biotech’s Frankenstein

Within the past few days, we have this:

Deadline Passes For Pfizer To Submit Results Of Post-Vaccination Heart Inflammation Study To US Regulators

FDA Deviated From Normal Process In Pfizer Vaccine Approval, Documents Show

Former Employees Sue ESPN After Being Fired For COVID Vaccine Refusal

Lead Author Of Research On Pfizer And Moderna Trials Warns COVID Vaccinations Must Be Stopped

Pentagon Drops COVID-19 Vaccine Mandate For Troops

Let’s see if the market’s ready to hand it to this sector. What’s the price action telling us.

Biotech SPBIO, Weekly

The weekly chart shows the potetial breakout.

However, since we’re looking at this from a ‘going short’ perspective (not advice, not a recommendation), the chart following this one is inverted.

When we invert the chart, it takes on a whole different look.

Biotech SPBIO, Weekly (Inverted)

If price action’s spent over three months getting where support has been penetrated only to have it fail into a reversal, the ensuing move has massive potential.

In Wyckoff terms, it’s cause and effect.

The ’cause’ has been three months of congestion. The ‘effect’ is a potential long duration, or wide volatility move.

Before The Open

It’s twenty minutes before the open and 3X leveraged inverse fund LABD, is trading higher by about +3.5%.

This is normal behavior whether we have a reversal or not.

One last check of ZeroHedge, before releasing this post turns up this:

Senator Questions CDC On Why It Claimed No ‘Unexpected Safety Signals’ For COVID Vaccines

The ‘monster’ continues to grow.

Stay Tuned

Charts by StockCharts

Note:  Posts on this site are for education purposes only.  They provide one firm’s insight on the markets.  Not investment advice.  See additional disclaimer here.

The Danger Point®, trade mark: No. 6,505,279