The financial press is rolling out the usual suspects; bonds yields are going stratospheric and hyperinflation’s just around the corner.

A more likely view, one that’s actually based on reality, the price action itself, bonds just changed hands; from weak to strong.
Those selling or going short bonds (weak hands) at this juncture are potentially left holding the bag in a big way.
Taking a trip back in time to Livermore’s day (Reminiscences), he stated time and again, the large speculators could not enter or exit their positions at will.
They needed to have some kind of ‘event’ with heavy volume so that it would mask their moves.
It looks like we just had such an event.
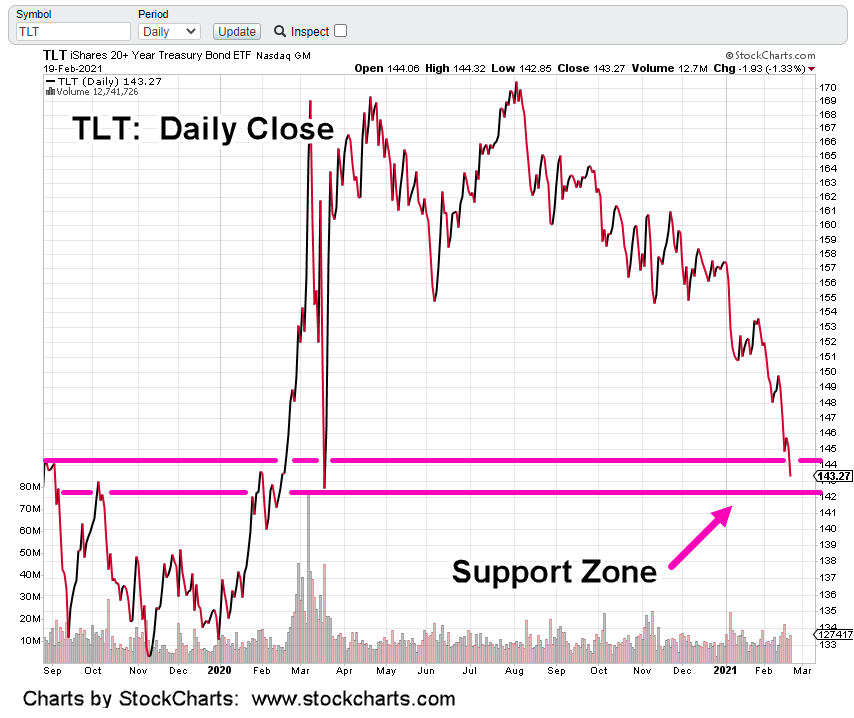
The weekly chart of TLT, shows two major volume spikes. One where bonds reversed lower and now … a potential reversal to the upside.

We’re dealing with probabilities and over two-hundred years of market activity (since the Buttonwood tree).
Huge volume spikes have significance. They typically signal a pivot or the start of one.
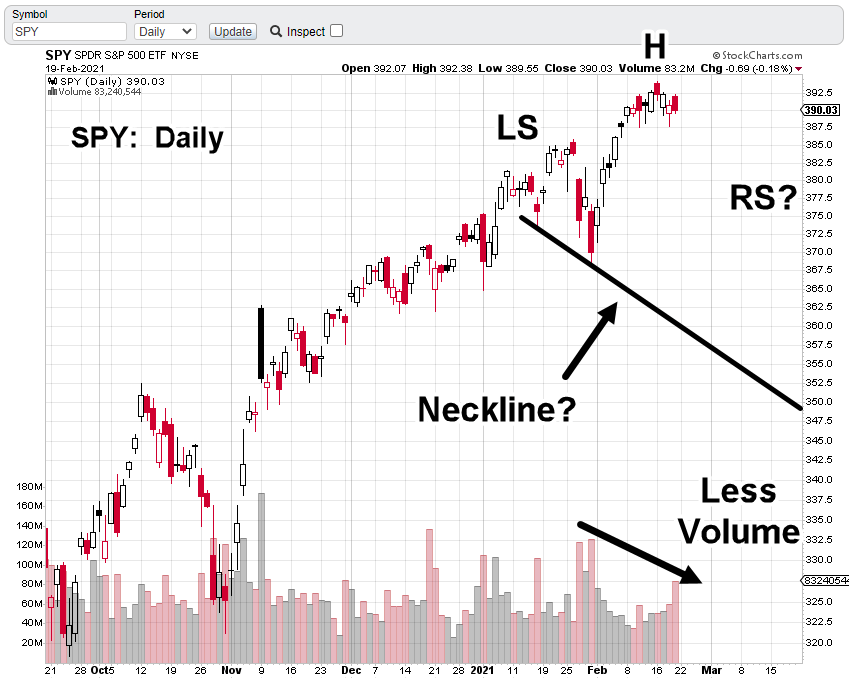
Using that reasoning, we may have seen confirmation of rotation not only in bonds but the markets themselves; The S&P, Dow, Nasdaq are pivoting lower, with bonds and the dollar reversing higher.
Summary:
The futures market opens in a few hours. It’s typically a light-volume affair for bonds.
At times, Steven Van Meter presents in his updates how bonds have been typically slammed lower in the overnight.
That type of action has been going on for months. We’ll be looking to see if there’s a change of character.
Stay Tuned
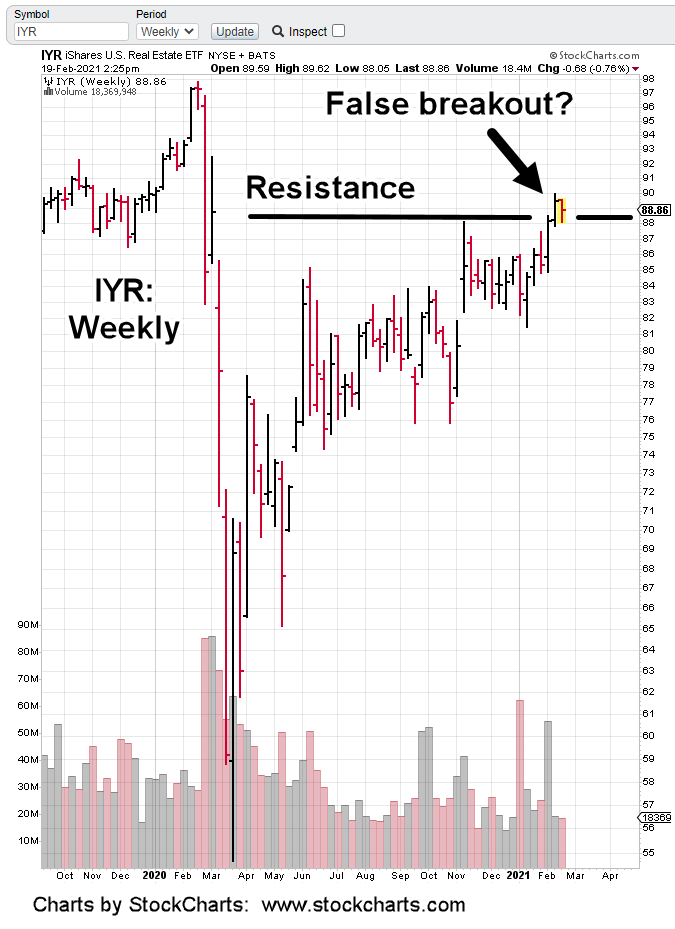
Charts by StockCharts