This is how it looks just before an up-side breakout. Of course we’re dealing with probabilities and the pattern could morph into something else.
However, at this juncture it looks about to move … higher.
The problem is and you may have already noticed, the chart does not look quite right. Why is price action at the bottom and volume at the top?
It’s inverted … turned up-side down.
We’re looking at Amgen (AMGN), inverted.
Inverting the chart is an old trading technique that’s used to remove analysis bias in one direction or other.
If a chart looks like a buy (or sell) no matter which way you turn it, there’s a problem … a significant trader’s bias that blinds one to the potential.
Amgen is the largest component in the biotech (IBB) sector. The coming week, may support or negate the breakout potential.
Note: Posts on this site are for education purposes only. They provide one firm’s insight on the markets. Not investment advice. See additional disclaimer here.
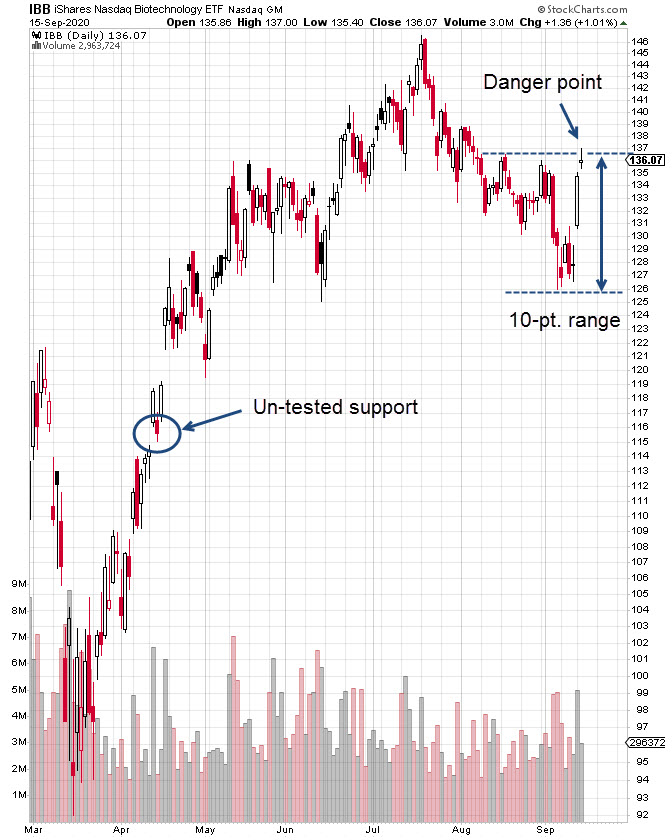
Right at the danger point, biotech’s (IBB) upward energy evaporates.
The 2-Day chart below shows a series of thrust energy units.
Going from 57-Million, all the way down to less than 1-Million (0.85-M), in six trading days.
An expandable version of the chart above (with additional technical data) is here.
Note: Posts on this site are for education purposes only. They provide one firm’s insight on the markets. Not investment advice. See additional disclaimer here.
Note: Posts on this site are for education purposes only. They provide one firm’s insight on the markets. Not investment advice. See additional disclaimer here.
Note: Posts on this site are for education purposes only. They provide one firm’s insight on the markets. Not investment advice. See additional disclaimer here.
Note: Posts on this site are for education purposes only. They provide one firm’s insight on the markets. Not investment advice. See additional disclaimer here.
Just before the all-time high in biotech (IBB), several screen shots of price-bar action were obtained.
Pasting it all together in an old-time flip-book format, we see the daily action of IBB over the past two months.
There’s no bonafide indicator that a top was imminent other than increased daily volume at the pivot.
That increased volume was a subtle clue more volume was not resulting in upward movement.
The next day, price action stalled and reversed.
The result is obvious but below the radar. IBB has not declined significantly enough, fast enough to draw outright attention.
This is precisely (not advice, not a recommendation) the area where Three Ten Trading established its short position.
In fact, as detailed in this update, the entire short position was exited and then re-established during this two-month long reversal.
The short position (via BIS) is now well in the green but ready to be exited at the first sign of trouble … all the while expecting further IBB downside ahead.
Note: Posts on this site are for education purposes only. They provide one firm’s insight on the markets. Not investment advice. See additional disclaimer here.
Keep the population continuously distracted: Wear your mask, be afraid, take the blue pill and follow orders; Sounds a lot like a certain European country in the early 1930s.
We’re in a long-term game plan(demic) of unprecedented wealth-transfer.
Part of this transfer is to keep the ‘market’ rising higher, while underneath, the foundation crumbles.
Those in the know, cash-out.
The vast majority of equities do not participate in the up-trend until the end. That end, is when the top ten, the top seven, the top five all the way to the top one, which at this point is Apple (AAPL), can’t go any higher.
In classical terms, the market ‘thins out’.
At this juncture and barring any surprise to the up-side, we see biotech (IBB) reached its all time high weeks, even months ago in late July.
There has been a steady, but halting progression lower until the past week.
If the 23.6%, retrace holds, it’s an indicator of substantial weakness in the sector.
Looking to what might be ahead, the weekly chart notations show a potential Head & Shoulders pattern in its very early stages.
A larger, more expandable version of the chart is here.
Fibonacci price projections (dashed lines) have been included to direct us to where price action may stabilize temporarily.
Those projections are based off the high-to-low and then rebound to the 23.6% retrace.
As always, anything can happen.
IBB could launch higher at the open on Monday and negate or severely damage the set-up. However, if it does not and continues lower, the H&S pattern remains in play.
Note: Posts on this site are for education purposes only. They provide one firm’s insight on the markets. Not investment advice. See additional disclaimer here.
It’s one hour before the close; biotech is hitting multiple technical flags simultaneously.
The weekly chart below, shows IBB retracing to Fibonacci 23.6% of its move from the July top.
Then it reversed.
Such a shallow 23.6%, retrace, where 38.2%, and 50%, are more common, indicates severe weakness.
It’s a harbinger of lower prices ahead.
In today’s session, just minutes ago, IBB posted an outside down (key reversal) daily bar.
So, we have a daily reversal within a larger, weekly reversal.
To make it technically correct for outside down, IBB would need to close below yesterday’s low of 127.99. So, we’ll see.
The short (not advice, not a recommendation) position via BIS, implemented by Three Ten Trading, has not changed. In fact, the short position has been increased since the last post.
There’s been no major break in IBB, yet. No air pockets, no negative news announcements.
As Livermore said a century ago (in 1923), ‘surprises happen in the direction of trend’.
Note: Posts on this site are for education purposes only. They provide one firm’s insight on the markets. Not investment advice. See additional disclaimer here.
That was a potential outcome proposed in this update, just seven days ago.
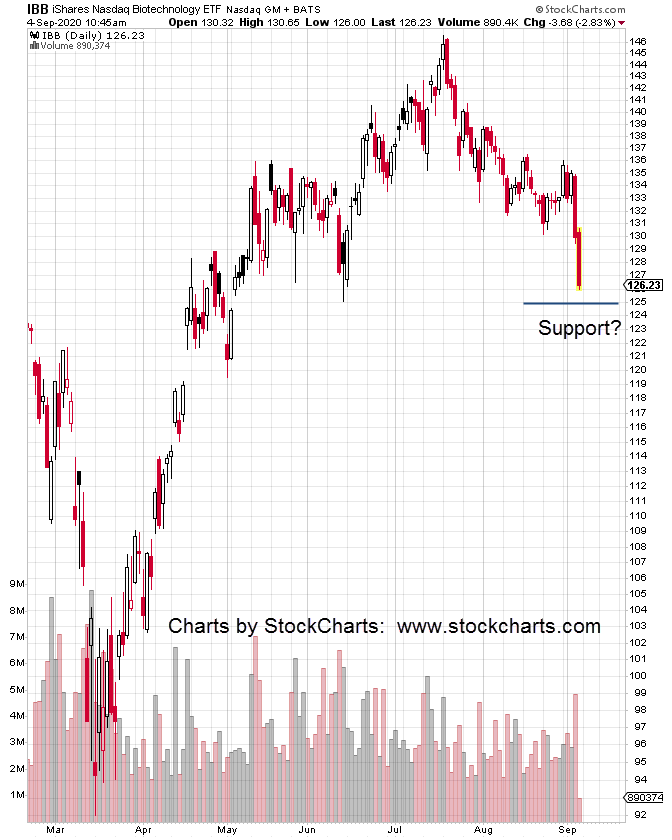
On September 3rd, five days ago, Biotech (IBB) had its largest down-draft since June 11th.
Coincidentally, on that same day, this news was released concerning polio outbreaks in Africa.
Scroll down the article and a familiar name will appear. It’s also the name that has provided significant backing for Moderna (MRNA).
Moderna has fallen off the radar. MRNA, with no P/E and no yield. What? Nobody wants to stampede into the ‘cure’?
The top of Moderna was identified in this post. Along with a summary that enough of the public had been fleeced on the way up; it was time to get them on the way down.
MRNA is now down 34% from the top and down 23% from the last update.
That might sound cruel or harsh to discuss the markets in this way. It’s not nearly as bad as what Dr. Elder describes in his first book; Trading For A Living (summarizing):
‘The markets are like a medieval battlefield. You enter with full knowledge you may not come back. You are trying to kill your opponent, and him, you.
If you lose, all you own goes to him, including the wife and children.’
So, being part of the herd, stumbling around in the markets waiting to “fleeced” sounds way better.
The original premise of going short biotech was technical, fundamental and political.
Technically biotech (IBB) is the only sector with a weekly MACD sell signal as identified in this post. Fundamentally, we’re using Stockman’s assessment the sector is ‘bottled air’.
Politically, the elites may be starting to fight amongst (and eat) themselves as evidenced by the news release linked above.
Anything can happen and IBB could bounce and move higher during the next session. From a probability standpoint, the foundation of farce appears to be showing its true identity and origins.
The daily chart of IBB, is following (at this juncture) a Fibonacci projection. We’ve met and bounced off the 61.8% level.
If the trend remains to the downside, the next projection is 100.00, then 161.80, at IBB levels (blue ovals) 120.00 and 110.00, respectively.
Note: Posts on this site are for education purposes only. They provide one firm’s insight on the markets. Not investment advice. See additional disclaimer here.
Note: Posts on this site are for education purposes only. They provide one firm’s insight on the markets. Not investment advice. See additional disclaimer here.










 The Danger Point®