Better Than Expected: Not Really

It’s just after the market open and there’s better than expected news on employment. That is, until you factor in temporary Census workers, skewing data to the upside. 

The Money GPS has long been providing real data and analysis (for years) on the market’s end-game.  Time stamp 7:24, at this link identifies the boost in employment numbers resulting from (Census worker’s) temporary hiring.

All this brings us back to price action.  What is the market saying about itself?

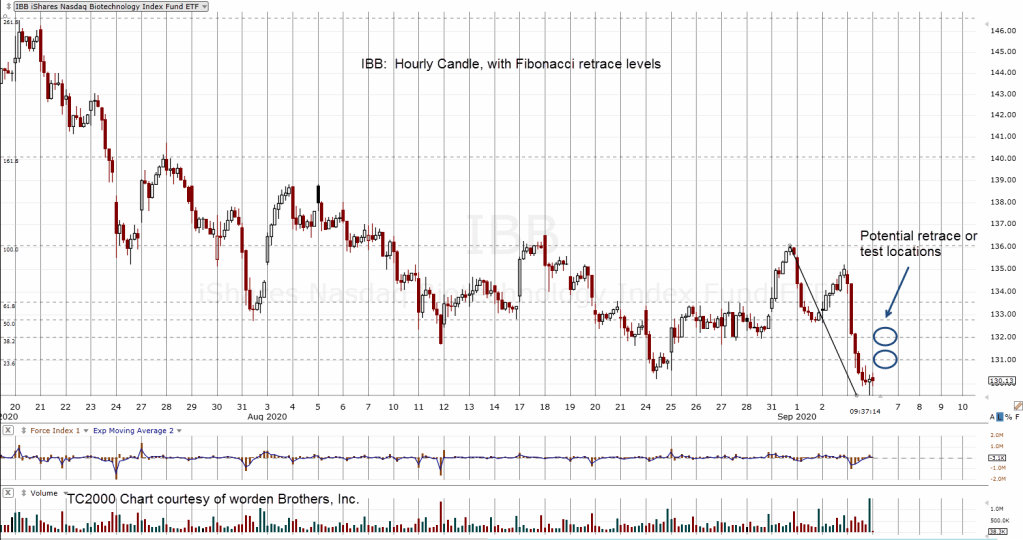
For biotech, there’s a possibility for a rise into a Fibonacci retrace level during this session. The hourly chart below, captured just three minutes after the open, shows the action thus far.

From empirical observation, IBB exhibits behavior where stop running, equalization of forces are complete around 11:30 a.m. EST. 

Depending on general market forces (S&P 500), if there’s going to be a reversal, it typically happens at (or before) that time.

If the down-trend is to continue, we’re looking for a test and reversal at either the 28.6%, or 38.2%, retrace level.

If or when that happens, it will be the trader’s discretion (not a recommendation) to either enter a short position or increase an existing position … or stand aside.

Note:  Posts on this site are for education purposes only.  They provide one firm’s insight on the markets.  Not investment advice.  See additional disclaimer here.

All But One

Of the nine market indices listed below, only one has a bearish weekly MACD cross-over:  Biotech

IYM:  Basic Materials

IBB:  Biotech

DIA:  Dow 30

IYT:  Dow transports

QQQ:  NASDAQ 100

IYR:  Real Estate

IWM:  Russell 2000

SOXX:  Semiconductors

SPY:  S&P 500

Yesterday, the indices were are at all time highs except for real estate (IYR), biotech (IBB), and Russell 2000 (IWM). 

Looking at IYR and IWM, we can see, although they are below the high, there’s still a persistent up-trend.

Even with today’s on-going reversal (three-hours before close), only biotech has posted a bearish, weekly MACD cross-over.

Of course, it won’t be known until after the fact why biotech is unique.  A hint at what might be the reason, is here (if it’s still available).

A gallery of the weekly index charts, listed above (as of 9/2/20) can be found here.

The focus of this firm, since June 3rd, exactly three months ago, has been biotech and its impending reversal.

A significant short position has been established over those three months via BIS, the 2X, inverse fund. Current Stop: 32.18

So, just what is ‘significant’?  How big is that?

To be transparent, without giving specifics, avoiding the usual internet keyboard warrior, and/or hater, the position is as follows:

We’re short what amounts to a full year’s wage for the typical American worker.  Fair enough?

When the position is closed out, results will be posted on the company site, located here.

Note:  Posts on this site are for education purposes only.  They provide one firm’s insight on the markets.  Not investment advice.  See additional disclaimer here.

Ten-Thousand: True or False?

That’s right.  Only 10,000 people in the U.S. have actually died of the ‘speck’ as the single mitigating factor.  True, or False.

shutterstock_26779105For those working the biotech sector,  it doesn’t matter.  Price action will decide.

This firm, is heavily short biotech for many reasons other than a potential (and likely) world-wide hoax.

We’re already expecting biotech to vaporize in a reversal and melt-down. 

Of course, if it turns out it really is the biggest hoax ever, how’s that going to affect all the biotech firms rapidly working on a cure for the common cold?

If the truth comes out all the pent up ‘investor’ demand for (or hopes to profit on) an injection are false, one could expect ‘vaporize’ to go ‘nuclear’ as everyone rushes for the exit.

Biotech price action shows it’s in a down channel. 

Yesterday’s session hit the upper channel line.  At the same time, it retraced a Fibonacci 38%, of the entire down move that began in July.

Today’s session was decisively lower. Price action posted a low below yesterday’s low (bearish).  In addition, IBB closed within the previous trading range; also bearish.

2020-09-01_15-15-55-IBB-Daily-4-bar-notes


Charts by StockCharts

Note:  Posts on this site are for education purposes only.  They provide one firm’s insight on the markets.  Not investment advice.  See additional disclaimer here.

Prepping For The Downside

The more sophisticated market participants work the downside.  That’s where the biggest (and fastest) money is made.

shutterstock_242289160Trading books and specifically Reminisces of a Stock Operator, (first published in 1923) detail how the wealthiest traders in the world prefer downside action.

The markets are now stretched to obscene levels and could go higher, still.

Just this past week, we have interest rates breaking out to the up-side, a-la August, 1987.

Being long anything other than corn or wheat and the occasional down-trodden coal miner,  seems to be a high risk plan (not a recommendation).

Positioning for the downside in the appropriate market, might be a lower risk option than riding the insanity to the top … wherever that is.

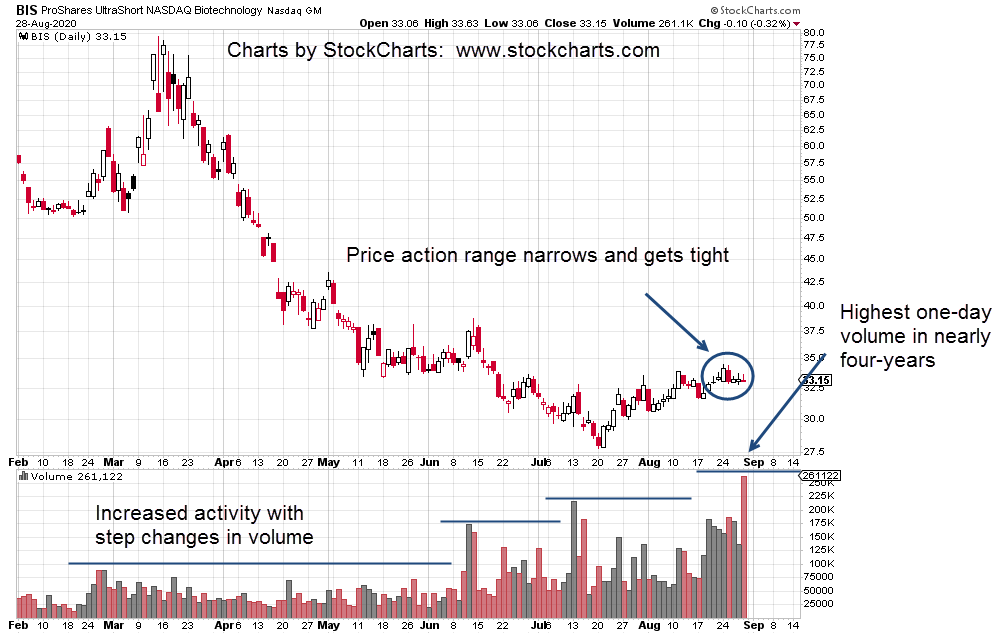
Which brings us to inverse biotech fund, BIS.  The daily chart shows the well-heeled know something’s up.

2020-08-30_9-32-52-IBB-Daily-5-bar-lanscape-notesSpeculative volume for potential downside in biotech is increasing.  Last Friday’s volume in BIS was the highest in nearly four years.

BIS was trading higher throughout the entire session until the last few minutes.  It closed slightly lower for the day and thus colored the volume bar red.

That minor BIS downturn (up turn in IBB) can be traced directly to Amgen (AMGN) which is now part of the Dow 30, effective Monday the 31st.

It’s important to note that for the past four months, volume activity in IBB has remained relatively unchanged.  Not so with BIS.

We’re nearing the Labor Day Weekend during the next sessions.  The market will be closed on Monday, September 7th.

Back in the day of 1929, the market made its all time high on September 3rd, the Tuesday after the Labor Day Weekend.


Charts by StockCharts

Note:  Posts on this site are for education purposes only.  They provide one firm’s insight on the markets.  Not investment advice.  See additional disclaimer here.

Hulking Shell

That’s what the average investor’s portfolio could be a scant two months from now if the analysis is correct.

Fotosearch_k7478570-BW-border

That is; markets are stretched to obscene levels, bonds breaking down, rates rising; the nearest corollary is August, 1987.

From a timing standpoint, it could be important.  That August was a Fibonacci 34 (-1) years ago.  Well within the margin of error.

Yesterday’s trade set-up (not a recommendation) was timed perfectly.

Today, that trade (if entered) would be up by about 2.8% at current levels.  The stop now gets moved to 15.54, today’s low.  Of course, this is for illustration purposes only.

For a bond trade, 2.8% is significant for a single day.  It looks like much higher rates are ahead.

Meanwhile, biotech (IBB) has given yet another sell, sell-short signal.  IBB briefly penetrated yesterday’s high of 133.39, and is reversing.

If price action continues lower, it’s a bull trap; a false breakout.

We’re actively short the sector via BIS (not a recommendation).

2020-08-27_11-53-45-TBT-Daily-5-bar-notes

Charts by StockCharts

Note:  Posts on this site are for education purposes only.  They provide one firm’s insight on the markets.  Not investment advice.  See additional disclaimer here.

Biotech Breakdown

Biotech is breaking down, now.

For this firm, going short has been an on-again, off-again, back on-again affair.

Fotosearch_k16630038-borderThose with engineering degrees (including this author) or some other science degree, would have decided long ago, since the original entry’s not perfect (being stopped out), the idea must be wrong.

Others easily distracted (those with i-phones) would have given up as well … only to see their (short) premise come to fruition without them.

So, here we are.  Biotech (IBB) is breaking down with inverse BIS moving higher while the overall market continues to rise.  As of this post, the S&P 500, is up 25-points or about +0.75%.

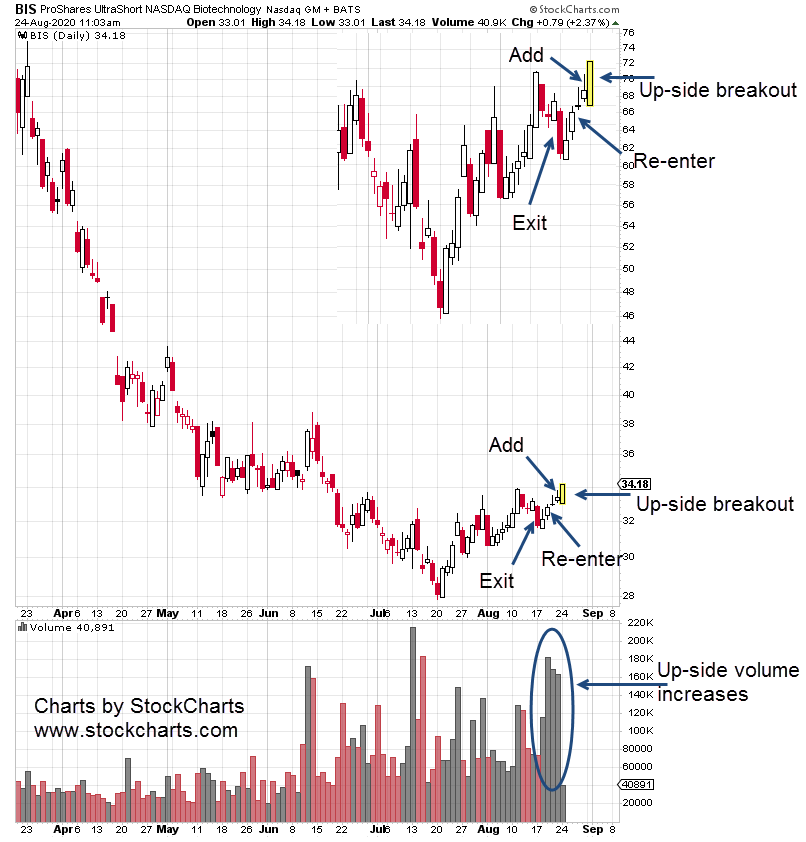
The chart and the expanded insert, show trading activity over the past two weeks.

2020-08-24_10-04-52-BIS-Daily-5-bar-notes-insert-notesPrior to the ‘exit’ point shown, we’re positioned long BIS (short biotech).  Then, price action broke down through the prior day’s low.  BIS was exited entirely.

Almost immediately after the break, the down-side price bar was challenged with up-side action.

After that, next day saw even more upside.  When new daily highs were posted, BIS was re-entered.

Two days later, last Friday, the trade was increased by 7%.  Just topping it all off for what amounts to a full position.

Since we’re using trading techniques from early masters, the last two months or so, mimic actions that may have been taken by Livermore or Wyckoff.

Not saying we’re in the same league as them.  Just saying based on their writings, the approach mimics documented trading behavior in the markets of their time.

At this point and being fully positioned, we wait.  Livermore put it as:  “Get right, and sit tight”.

An obvious stop level is anything below today’s BIS low of:  33.01.


Charts by StockCharts

Note:  Posts on this site are for education purposes only.  They provide one firm’s insight on the markets.  Not investment advice.  See additional disclaimer here.

Corn Flattened

Ten percent of the U.S corn crop was instantly wiped out last week during what’s described as an inland hurricane.

The video here goes into more detail about correlating events.

iStock-1019396932

To limit the food supply even further, driving prices higher under the guise of inflation, the ‘speck’ (time stamp 6:00) has invaded 100% of tested agriculture workers in California.

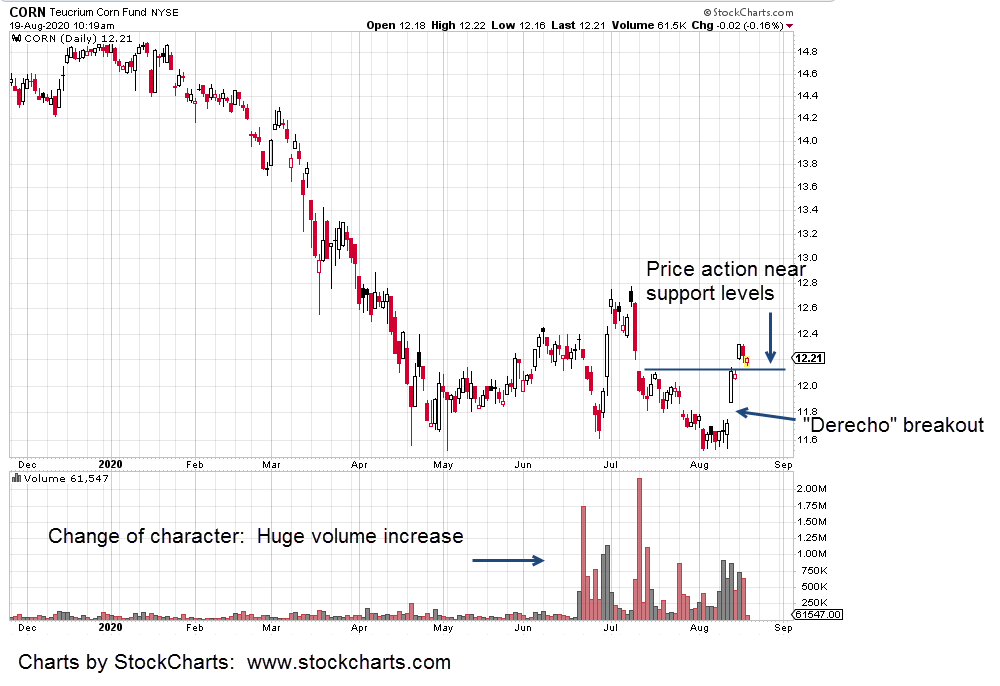
The corn ETF mentioned at Time Stamp, 4:16, in the linked video is shown below:  CORN is the ticker symbol.

The ‘derecho’ breakout is clear.  Currently, CORN price action has retraced slightly and is testing support levels.

2020-08-19_9-20-04-CORN-Daily-4-bar-notes

In separate markets, biotech (IBB) has posted another sell, sell-short signal with this session’s new daily low (not financial advice).

Silver is reversing as expected.

Whether or not this is just the beginning of a long down move to form new lows (for SLV), is unknown.  Of course, such a position or thought is, completely opposite the consensus view.

Charts by StockCharts

Note:  Posts on this site are for education purposes only.  They provide one firm’s insight on the markets.  Not investment advice.  See additional disclaimer here.

Shorting The Bond Market

Who goes first?  Do bonds break to the downside, rates up, market reverses lower into a potential crash; a-la October 1987?

Or, does the market (S&P 500) peak and reverse with a flight to safety (bonds) that mitigates or negates a sharp rise in rates.

Fotosearch_k6354877Maybe it’s stocks and bonds going lower together.  No safe havens.  Is it possible?

Early this session, the ten-year rate (inverse of bonds), is hovering just below the trend-line shown in the last post.

The bond bull market has lasted forty years.  Since 1980.  Obviously, at some point, it’s over.

With long bonds (10-yr, 20-yr) hovering near a breakout to lower levels, all it would take is some kind of ‘event’ to tip the scales.

Remember that Prechter  (no matter what you think of him) said years ago, the market leads the news … not the other way around.  It’s a complete mind-shift to understand that market position, price action, actually set the conditions for news events.

The market does not ‘react’ to the news, it ‘creates’ the news itself.  So, the bond market may be about to create an event.

With that in mind, inverse fund TBT attempts to give exposure to twice the downside of the 20-year bond.

In a nutshell, if the long bond moves lower, TBT moves higher at approximately twice the percentage amount.

The chart of TBT is below and it looks very similar to the $TNX chart in the prior update.  Looking closely, one can see the downward bias errors.  With each move lower in the $TNX, the TBT moves lower still.

It’s common with all inverse funds.

2020-08-17_9-07-32-TBT-Daily-3-bar-notesEffectively trading TBT requires a sustained down move in the corresponding market (to mitigate the down-bias).  The latest example shows bonds ready to break lower with rates ($TNX) moving higher.

TBT could be in a position for trade entry (not advice).

Additionally, if bonds break decisively lower, they have potential to stop dead what’s left of the economy:  Housing market, lumber market, building construction, and on.

Remember ‘the speck‘.  It’s all about the speck floating through the air.

On a separate topic and as a courtesy (not financial advice), the short position in biotech via BIS, was closed early this session as price action hit the pre-determined 8.15, stop.

Gain on the overall short position was about 5%.


Charts by StockCharts

Note:  Posts on this site are for education purposes only.  They provide one firm’s insight on the markets.  Not investment advice.  See additional disclaimer here.

Downside Leader

Two months ago in this post, the idea was floated that biotech, IBB may be the downside leader.

It certainly didn’t look like it at the time.

Biotech even went on to make a new high … potentially negating the theory.

shutterstock_146355983It’s different now.

After that new high, IBB has reversed and is trending lower.

On the other hand, the overall market, S&P 500, continues its push upward.

It’s within 1% of all time highs.

Pre-market action as of this post, has the S&P opening up about 0.4%, higher … ever closer.

At this juncture, biotech has hinted at downside leadership.  That hint my become a solid fact if and when the S&P has a decisive downside reversal.


Note:  Posts on this site are for education purposes only.  They provide one firm’s insight on the markets.  Not investment advice.  See additional disclaimer here.
Amgen (AMGN) Breaking Down

Amgen’s the heavy hitter, the leader in the biotech sector.  It’s by far the largest cap equity in the IBB, ETF.

Right now, AMGN is pushing down through support; confirming a down trend that essentially started on July 28th, last week.

shutterstock_793257808At this juncture, AMGN price action’s at the danger point. It can go either way with a confluence of orders; buy, sell, and sell-short.

If the trend-line (chart below) is not broken to the upside, AMGN is moving lower at a whopping -90%, on an annualized basis.

As stated, the firm sponsoring this site is heavily short in this sector; increasing the short position on a near daily basis.

Obviously, this is not a recommendation.  We can’t do that as stated in the disclaimer below and here as well.

The inverse fund BIS, that’s being used to position short as with other inverse ETF funds can blow up (or fail) unexpectedly.  We’re well aware and cognizant of the conditions under which that type of anomaly may occur.

At this point, BIS is ‘well behaved’.  However, BIS may be exited at any time and without notice.

By this time it should be quite evident that we (U.S. citizens) and the rest of the world are smack-dab in the biggest, most dangerous farce in world history.

Anyone with two synapses rubbing together can see there is ‘no scientific evidence of anything’, stated at time stamp 9:22, in this link.

2020-08-06_10-40-48-AMGN-Daily-5-bar-notes

If or when the truth-cork finally pops out of the bottle for all to see, it’s too late.  The emperor has no clothes.  That emperor is biotech.

Recognize in the markets, anything can happen.  It’s possible and likely probable another false narrative will be launched to manipulate the weak.  The current narrative is losing effectiveness.  If so, the next one has to be even more outlandish.

Alien invasion anyone?

Back to biotech.  If AMGN breaks its trend to the upside, the reversal scenario is either negated or modified.

Trend-line break or not, there’s a false narrative at play.  Those not able to see and those not willing to take action, risk being swept away with the tide.


Charts by StockCharts

Note:  Posts on this site are for education purposes only.  They provide one firm’s insight on the markets.  Not investment advice.  See additional disclaimer here.