What’s Working … What’s Not

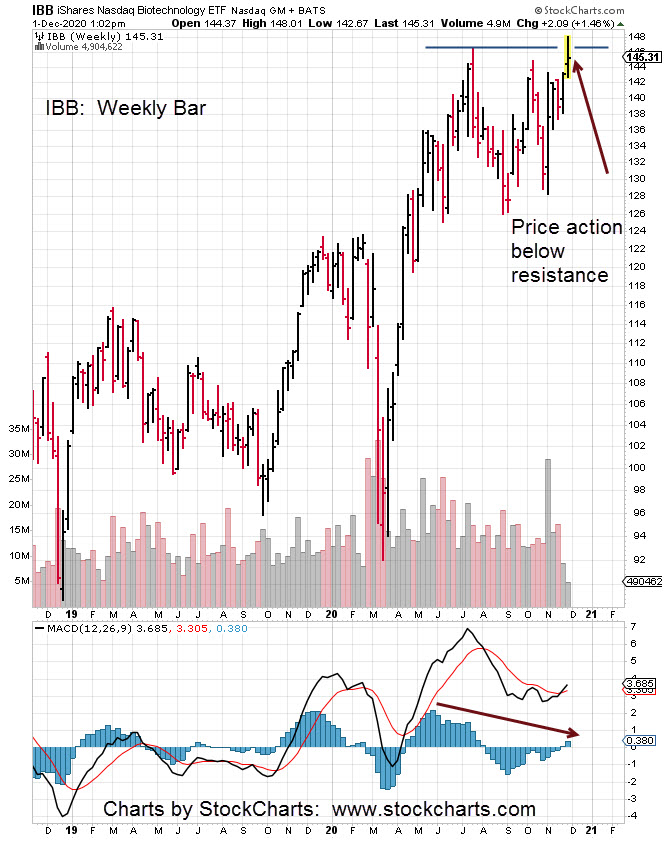
The final arbiter is price action itself.  We can analyze all we want but if the position does not cooperate, it’s time to leave.

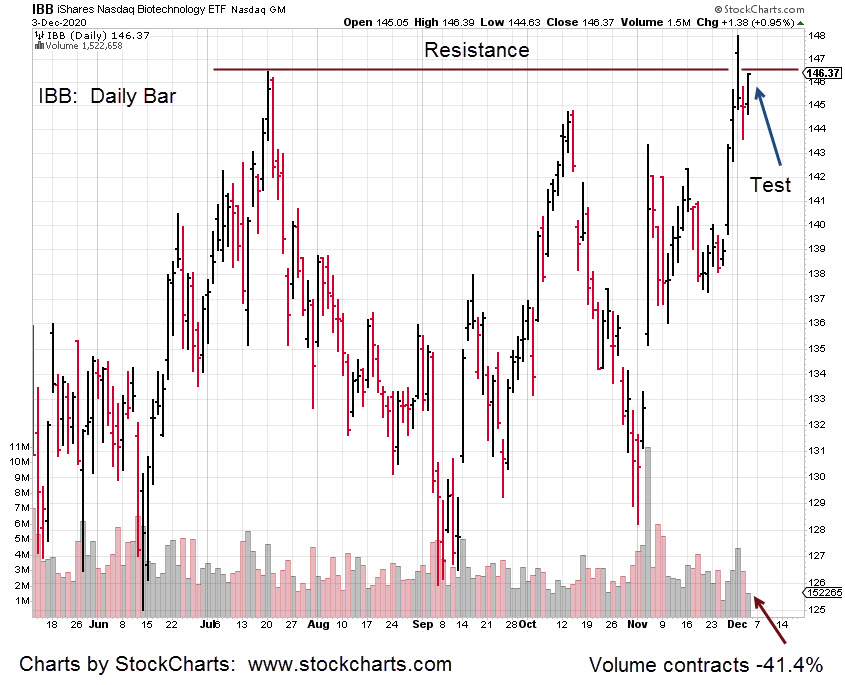
Similar to closing nat-gas positions on November 3rd, as detailed here, it’s time to move on from Biotech; let it play out without us.

Biotech’s not working on the short side. So, we’ll come back when it is.

It’s important to note, after leaving UNG, it’s -21.2%, lower than November 3rd.

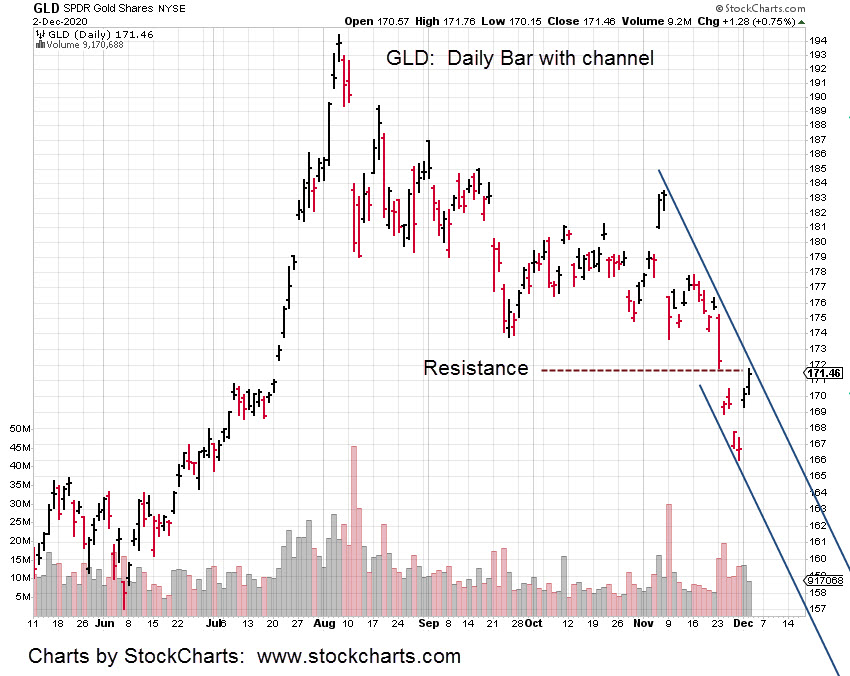
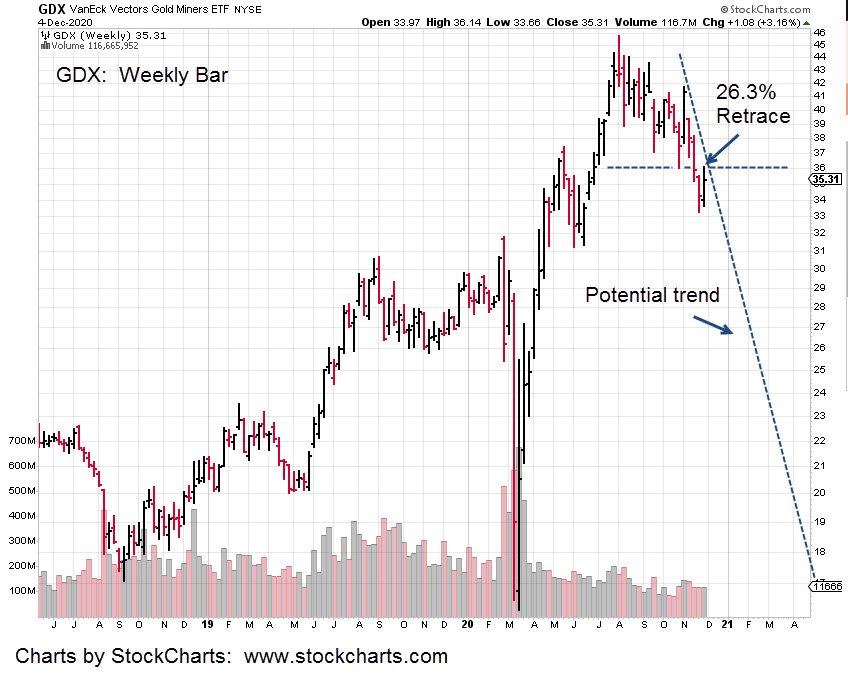
What’s working (for shorting), is gold and the miners (GDX) via DUST (not advice, not a recommendation). The GDX chart below shows the resistance level which is also the 23.6%, retrace.

A Fibonacci 23.6%, retrace is rare. 

If that level is not challenged and GDX continues lower, the shallow retrace (to the upside) indicates significant weakness.

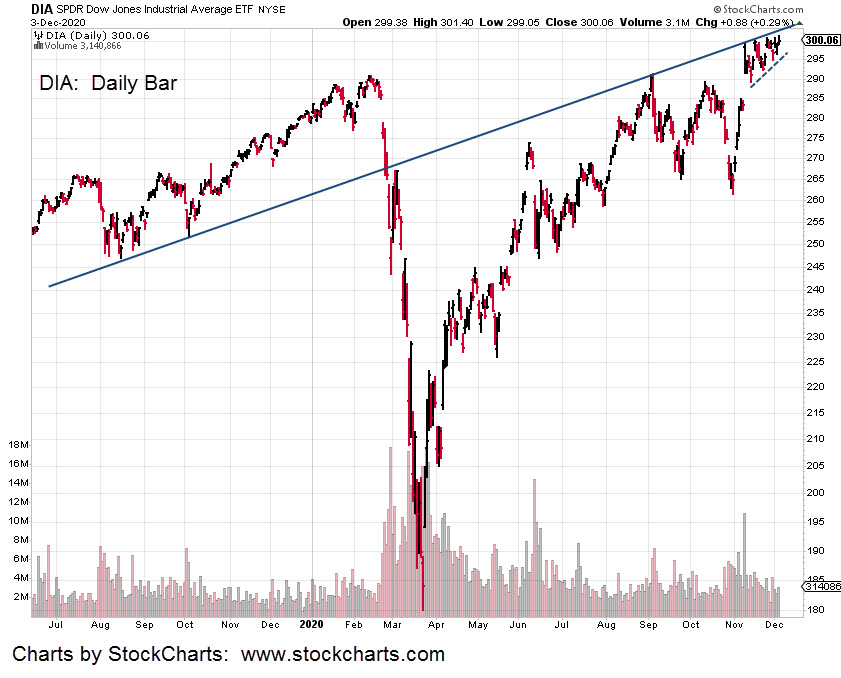
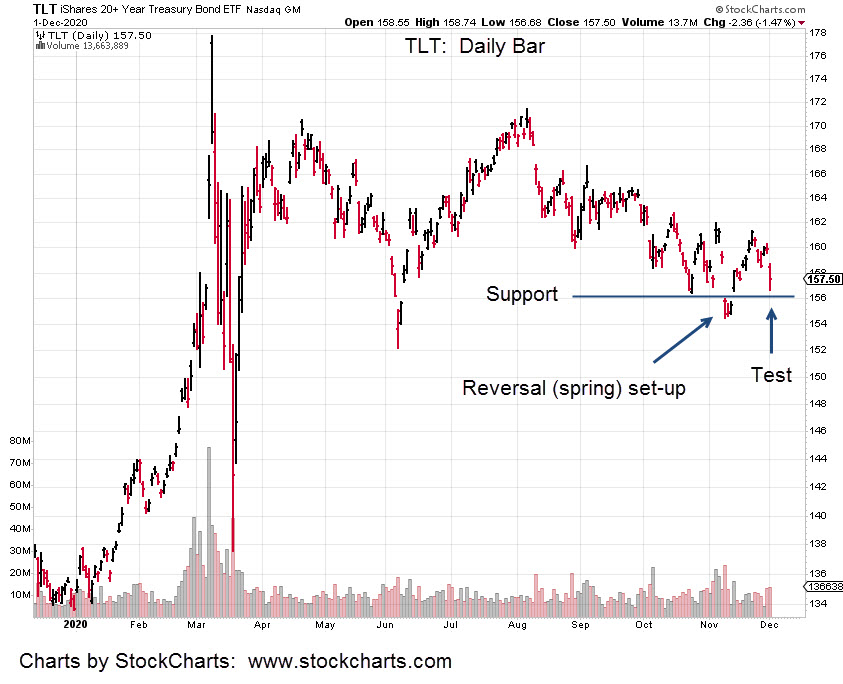
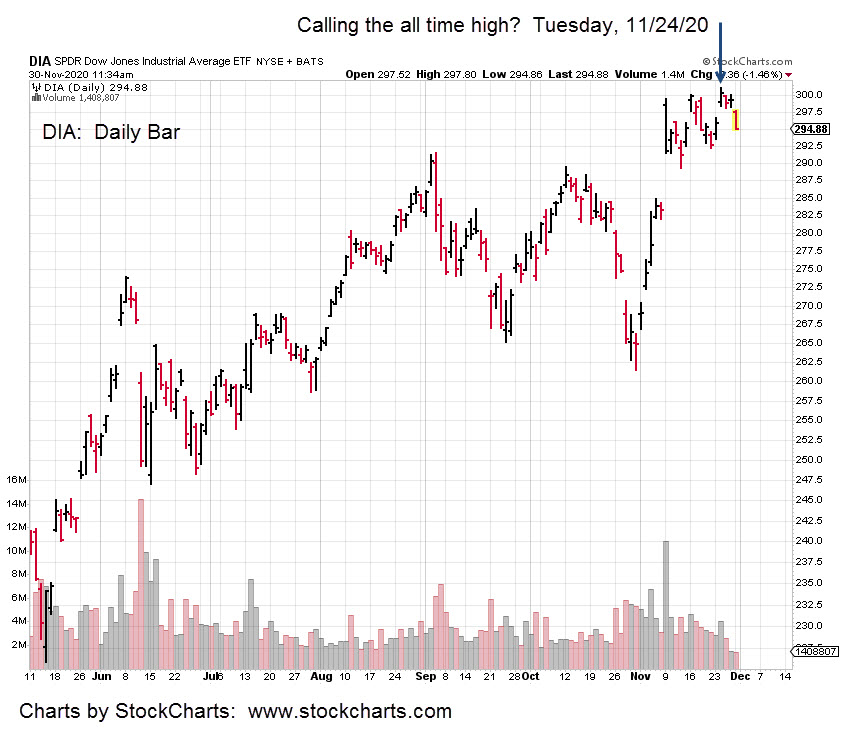
Recap:  Markets (S&P, Dow, NASDAQ) at all time highs.  The 30-yr Bond and Dollar, at short level extremes; the most in history.

Gold and GDX appear to be out in front, leading the way lower.

Managed Accounts

Number                     Detail             Position        Stop

6XXX-XXXX            Short GDX     DUST             21.81

5XXX-XXXX            Short GDX     DUST             21.81

Charts by StockCharts

Note:  Posts on this site are for education purposes only.  They provide one firm’s insight on the markets.  Not investment advice.  See additional disclaimer here.

Before The Open

In the pre-market (8:52 a.m. EST) action continues to grind higher.  Both the Dow and S&P have posted new highs thus negating the Holiday Turns scenario … but not by much.

Important to note is each market continues to post on the underside of a long-term trend-line.  The Dow chart (DIA) is farther down this post.

Also added to the chart is the dashed trend-line underneath the recent price action.  A wedge is being formed; typically last stop before reversal.

In other markets, looks like Biotech may continue higher but along with the others, action appears labored.

The short position could be stopped out at the open. 

This area of price action is where cost of being wrong is least.  We’re at The Danger Point.

Update: 9:04 a.m. EST: Both AMGN and MRNA have now posted lower in pre-market.

Stopped out does not mean there’s no opportunity.  The bearish MACD divergence is still there.

If IBB continues higher, the original ‘150’ target is back in play.

The market extremes are still there:  Bonds and the Dollar are short the most in history.  Stretched all around.

It’s not unreasonable to expect several attempts to position short.

Charts by StockCharts

Note:  Posts on this site are for education purposes only.  They provide one firm’s insight on the markets.  Not investment advice.  See additional disclaimer here.

Biotech: By the Book

If during a reversal, price action comes back on contracting volume, the reversal has been tested.

Biotech, IBB has done just that.  It’s a near textbook example. 

Today was upward action. An exact Fibonacci 61.8%, retrace of the three-day move with volume contracting over 41% from the prior session. 

Under such conditions, there’s high probability of an immediate resumption of the reversal trend.

We’ll see if biotech (IBB) resumes the downward reversal at the next session; Tomorrow, Friday.

Market positions remain unchanged (not advice, not a recommendation) and shown below

Managed Accounts

Detail              Position         Stop

Short GDX     DUST             20.44

Short IBB       BIS                  25.46

Charts by StockCharts

Note:  Posts on this site are for education purposes only.  They provide one firm’s insight on the markets.  Not investment advice.  See additional disclaimer here.

Gold: Resistance & Retrace

Instead of reversal in the overnight, gold went higher. 

Keeping with the potential down-trend theme, we’ll pull out to the next larger time-frame; the weekly.

The 23.6% retrace level, is approximately 172.60 – 172. 70, when measured on the weekly chart.  Pre-market action in GLD (as of 8:55 a.m. EST) is at 172.40 – 172.60 range. 

So, we’re there.

This is a good example of price action coming back to test wide, high-volume areas such as posted last week.  It’s what markets do.

From a trading standpoint, the DUST position could be stopped out if price action remains at this level to the open. 

Not a problem.  Every trading action results in creating another data point for a future entry.

Moving on to Biotech (IBB): 

Using LABD (3X Inverse IBB) as the high-volume proxy, it’s oscillating in a narrow range and essentially unchanged.

Separately, David Quintieri at the Money GPS, comments here, that he’s being chided for not giving financial advice and not indicating which stocks to buy.

In addition, Steven Van Metre, in this report states the Dollar and 30-Year Bonds are shorted to unbelievable, historic extremes.

He also states that ‘when the market finally reverses, it’s going to be violent.’

The wipe-out, when it comes will likely be on several fronts. 

Food supply

Power gird

Cyber attack

Speck

Markets

Riots

After those events transpire, figuring out which stock to buy won’t be anywhere on the list.

Stay Tuned

Charts by StockCharts

Note:  Posts on this site are for education purposes only.  They provide one firm’s insight on the markets.  Not investment advice.  See additional disclaimer here.

Gold: Reversal Now?

If the trend is in-effect as shown, GLD could reverse tomorrow or in the overnight session.

The senior miners (GDX) stalled during today’s session.  Price action is still at the Fibonacci 23.6%, retrace level.

To help clarify the firm’s positions, the following detail is provided as a courtesy only.

Several accounts are being managed.  Currently there are two open positions in separate accounts (not advice, not a recommendation):

Managed Accounts

Detail              Position         Stop

Short GDX     DUST             20.44

Short IBB       BIS                  25.46

Everyone has their own style.  Ours adheres to tenets laid down by three market masters from the early 1900s.  Detail on those criteria can be found here.

One of the reasons for choosing Livermore, Wyckoff and Loeb, is that no evidence exists these individuals were part of any full scale corruption or being the lap-dog for the globalist elite.

That statement is the complete opposite of what we have today. At this stage, the corruption and lap-doggery should be obvious to all.

Charts by StockCharts

Note:  Posts on this site are for education purposes only.  They provide one firm’s insight on the markets.  Not investment advice.  See additional disclaimer here.

Bond Test

Bonds (TLT) were hit hard during the last session.  Are higher rates ahead?

The short answer is no … if the test shown in the TLT chart holds.

What we have is typical market action at a significant reversal. 

Putting it in perspective, the push below support (blue line) lasted a full three days before reversing higher.

Then we have twelve days of upward recovery until yesterday.  Price action was slammed -1.57%.

It might look like we’re headed back to lower bond prices and higher rates; in effect, what we really have is a test of the reversal.

You can almost feel it. A major event is near.

The equity markets at all time highs … extremes of ‘retail’ participation never seen before. 

Couple that with the largest-ever short position in the bond market (about to get squeezed). 

The dollar’s at the bottom of its trading range … gold already heading lower.

The sense is a major market reversal is very near.  It’s probably already happening but just not obvious enough … yet.

We’re not going long the bond market but rather going short other markets.

Most of the short position in DUST was exited during the last session when price action came back to the intra day highs.  The potential squeeze got a reprieve at least for the day.

It’s important to note, yesterday’s GDX move went to a near exact Fibonacci retrace of 23.6%.  The down-trend could proceed at any time.

Separately, a short was entered in the biotech sector via BIS (not advice, not a recommendation).

Pre-market activity (as of 9:02 a.m. EST) for IBB indicates a lower open with BIS correspondingly higher.

Charts by StockCharts

Note:  Posts on this site are for education purposes only.  They provide one firm’s insight on the markets.  Not investment advice.  See additional disclaimer here.

After The Close: Biotech

Attempted breakout that failed … thus far.   That was today’s action for Biotech (IBB).

The (weekly MACD) divergence set-up has been in the works for awhile.  The first time weekly MACD was discussed was this report nearly two months ago.

With the Dow reaching an apparent top last Tuesday and with other markets (S&P, NASDAQ) following suit today, there’s potential we’re at a pivot point.

Note that Biotech’s all time closing high remains IBB 145.80, reached back on July 20th, this year.

Volume for today’s session increased 43% over yesterday. However this session only pushed 0.23%, higher; opposed to a 1.23%, gain on Monday. 

Upward progress slowed significantly in the face of higher volume.  The bulls are tired.

While external world chaos rages, here, here and here, we’re focused on price action and taking advantage of low risk opportunities.

The response was to go short via BIS (not advice, not a recommendation) at BIS 25.61, with a stop set at BIS 25.46.

Note on stops and trading:

Every speculator has their style.  We’re perfectly comfortable getting stopped out and re-entering several times on what is considered a viable set-up.

The current position may be stopped out at the next session.  Depending on the price action at the time, the bearish divergence on the weekly may still be in effect and allow for a re-entry into the trade.

Charts by StockCharts

Note:  Posts on this site are for education purposes only.  They provide one firm’s insight on the markets.  Not investment advice.  See additional disclaimer here.

Biotech Short: Initial Entry

At this juncture, 1:12 p.m. EST, IBB has retreated from the all time highs.

A close below resistance at this session would be significant

Just 1.99-points shy of the target: Initial short via BIS @ 25.60 (not advice, not a recommendation).

Charts by StockCharts

Note:  Posts on this site are for education purposes only.  They provide one firm’s insight on the markets.  Not investment advice.  See additional disclaimer here.

Biotech (IBB) Nears Target

Pre-market activity shows IBB near 147.00, just 3-points away from the 150, target and right at the high set on July 20th, this year.

If IBB reaches that target (this week), it would automatically set-up a bearish divergence on the weekly chart.

That divergence would be on both the MACD lines and the histogram … a rare occurrence.

It’s not an automatic short entry (via BIS).  It’s a low risk area that’s important to watch.

In other markets, gold (GLD) has rebounded, up about 2% in the pre-market. However, price action remains in a congestion area of both resistance and support between 165 – 170.

The miners GDX are up as well and also hitting the underside of resistance. 

In addition for GDX, the 35.80 – 35.90 area is a 23.6% Fibonacci retrace for the entire down move that started on August 5th this year.

From a trading perspective, we’re short the sector (not a recommendation, not advice) and have a stop in DUST that is likely to be hit at the open.

If this action in GLD and GDX is just short-covering, we’ll know fairly soon. Under such conditions, price action begins to erode quickly as the shorts cover and the bulls are too weak to keep prices higher.

The short (DUST) position may be re-established (not advice, not a recommendation) during this session or following ones.

The bearish assessment of the mining index (and gold) has not changed. Gold and the miners may be leading the way down as reported here

The market will do everything in its power to make sure it throws off and frustrates as many bulls/bears as possible.

Charts by StockCharts

Note:  Posts on this site are for education purposes only.  They provide one firm’s insight on the markets.  Not investment advice.  See additional disclaimer here.

Was That The Top?

“If the market (S&P, Dow, NASDAQ) opens lower tomorrow, Friday and continues decisively lower, we might add Tuesday, November 24th, 2020, as another empirical data-point for Holiday Turns.”

The quote above was from last Thursday’s update.

Well, it looks like the market waited one additional day to make its turn.  For the Dow 30, last Tuesday the 24th, was indeed a high.

We’ll see how far this one goes.  It’s a high but whether or not it’s THE high is not known.

Given the market conditions being reported on this site, long positions look tenuous indeed (not advice, not a recommendation).

The ever helpful, knowledgeable financial media says ‘it’s the best month since 1987’.  No elaboration on that one is necessary.

The takeaway is, understanding that market pivots tend to occur during a holiday week … when no one is looking.

In other markets, gold (GLD) continues lower and is attempting to take the miners (GDX) down as well; currently oscillating near unchanged.

Biotech pushes into its breakout but at this juncture (11:53 a.m. EST), it looks weak and may not have energy to get to a new all time high.

It should be obvious the manipulators are hard at it … attempting to get the sector (IBB) to move high enough for gains on the long side, then turn around and establish low risk short positions.

Wyckoff noted that under such conditions (exit longs, enter shorts), daily volume will be two-to-three times greater than typical.

Chart of DIA is below … showing reversal since last Tuedsay, the 24th.

Charts by StockCharts

Note:  Posts on this site are for education purposes only.  They provide one firm’s insight on the markets.  Not investment advice.  See additional disclaimer here.