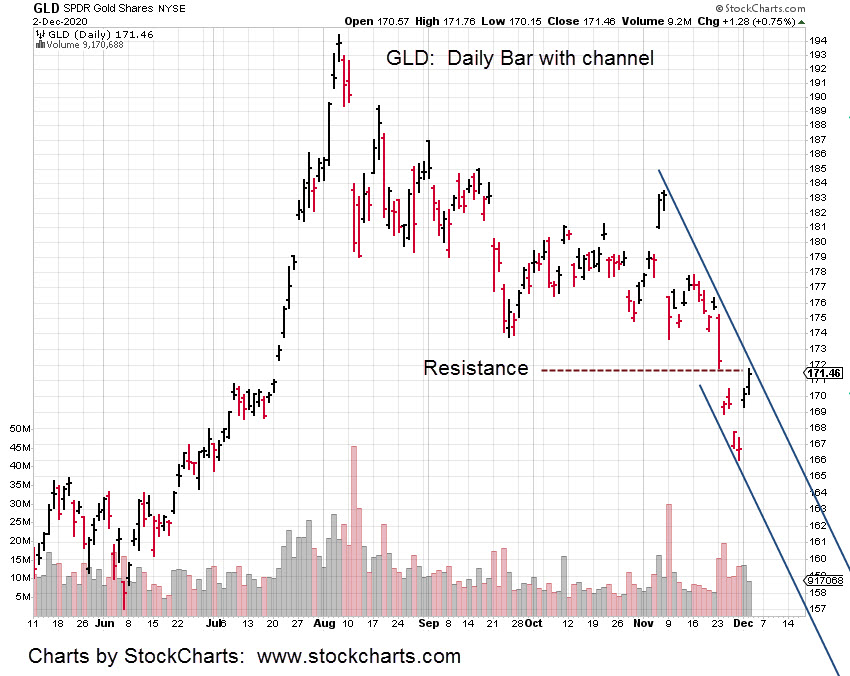
While gold (GLD) remains in the channel presented here, the corrective move does not appear complete.
We’re using a daily (close) chart of GLD to show the current “a-b-c” correction unfolding.
The corrective wave labeling in lower case letters, takes its cue from Elliott Wave analysis.
The solid line marks an axis line already defined by price action.
That line (~177.50) just so happens to be a 38.2% retrace of the entire GLD move (from the August 6th high) as well as 61.8% of the distance covered by wave “a” (when measured from wave b).
The wave “c” of a corrective move tends to mimic a Fibonacci length of the initial wave “a”
Typical wave c lengths (of a) are 38.2%, 61.8% and 100%, or equal length.
Empirical observation has shown “c” wave distance of 50%, usually moves on higher to at least 61.8%.
From a timing standpoint; Fibonacci 13, days from the November 30th low, is December 16th; Fibonacci 21 days is December 29th.
Note: Posts on this site are for education purposes only. They provide one firm’s insight on the markets. Not investment advice. See additional disclaimer here.
For the hyperinflation crowd, yesterday’s weak action in gold must have been a surprise.
That action may signal a change in character. The GLD chart shows the long supposed bull flag that’s been going on now for nearly five-months.
If the dollar’s in free-fall destruction, then you would expect precious metals to be on a tear.
Not happening.
Going way back to a real bull market like the launch of the S&P in 1995; we can see strong bull markets are unexpected, violent, and do not allow anyone to get aboard comfortably.
That market lift-off lasted a full eighteen months before a meaningful pull-back.
Gold on the other hand appears punch-drunk.
The chart shows two trading channels. The one we know and the one that may be happening now.
In today’s action, gold could attempt to close the gap.
How price action behaves as it (or if it) moves upward will give clues to whether or not it’s now counter-trend to test (before reversing), or impulsive, gathering steam for a breakout higher.
The dollar is at trading range lows. Bonds appear to be completing their test of the Wyckoff spring set-up discussed here.
There are still massive short positions on both. Probabilities favor counter-trend action in gold with the real downward push yet to come.
Note: Posts on this site are for education purposes only. They provide one firm’s insight on the markets. Not investment advice. See additional disclaimer here.
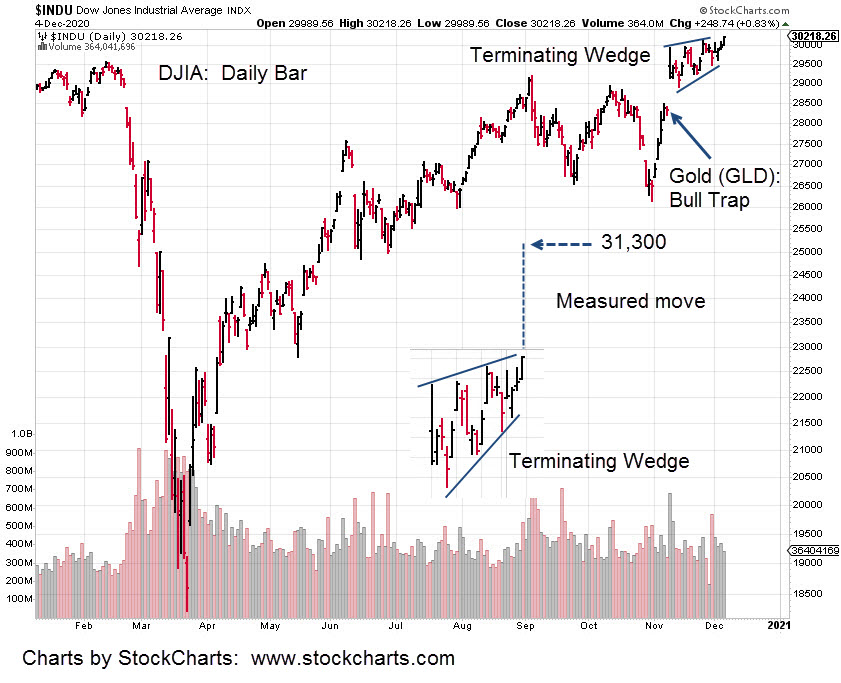
The Dow can either reverse right here or breakout higher from its wedge.
Since the trend is already up, a breakout to the upside is more likely. Such a move brings in a forecast to around 31,300.
The daily chart below has the last part of the wedge expanded and posted at the bottom of the chart.
Important to note is the location of the Gold (GLD) bull trap.
Recall, the firm went heavily short (via JDST) on that Friday and had to wait over the weekend to find out if the analysis was correct.
This excerpt (emphasis added) is from the November 7th, update. It was a Saturday; we’re already short and waiting.
“No doubt, there are a lot of well respected traders, analysts, YouTuber’s that are on the bullish side of the market. Here are just some examples, here, here, and here.
So, at this juncture, this firm is taking the opposite side of the trade with its re-established position in JDST.”
The following Monday in the early morning hours, gold prices collapsed. The bulls were trapped.
As the market opened with gold down hard, the Dow and S&P both spiked up in what’s now a terminal wedge.
‘Terminal’, because this type of price action typically comes at the end of a sustained move … up or down.
At this juncture, the firm is positioned short gold (via DUST) with a tight stop (not advice, not a recommendation).
The stops (two trading accounts short) are not mental, out of the market but are actual open GTC stop orders.
That way if there’s an internet upset or power grid problem, the in-the-market stops will provide some amount of protection.
All of the above may be an excellent analysis of current conditions.
However, behind the scenes, the macro or the real agenda, is deadly serious.
The ‘plan’ all along is to destroy (and subjugate) the middle class. That’s been in the works for decades. Neo Feudalism.
ShadowStats reports here, real unemployment spiked to 35% early in the year and has come down to just over 25% now.
That level is still above 1930s, depression-era numbers and we’re just at the first wave of middle class destruction.
Throw in more economic turmoil and a stock market crash. Then we have ‘fait accompli’. Only a tiny remnant could be left unscathed.
Note the picture at the top: The haves and have-nots.
From The Money GPS: ‘The chasm in-between the haves and the have-nots, grows every single day’
Self employment is the key. It’s not a guarantee but it does offer flexibility and most importantly it may offer some extra time.
The above statements may seem harsh (possibly outlandish) to those not yet awake.
To help in that area, two links are provided here and here. See for yourself whether or not we’re at a critical juncture.
Based on yesterday’s analysis, the expectation is for gold and the miners (GDX) to continue lower.
If they do and the markets (Dow, S&P) continue higher, it’s just one more indication the time for reversal is near.
Note: Posts on this site are for education purposes only. They provide one firm’s insight on the markets. Not investment advice. See additional disclaimer here.
Instead of reversal in the overnight, gold went higher.
Keeping with the potential down-trend theme, we’ll pull out to the next larger time-frame; the weekly.
The 23.6% retrace level, is approximately 172.60 – 172. 70, when measured on the weekly chart. Pre-market action in GLD (as of 8:55 a.m. EST) is at 172.40 – 172.60 range.
So, we’re there.
This is a good example of price action coming back to test wide, high-volume areas such as posted last week. It’s what markets do.
From a trading standpoint, the DUST position could be stopped out if price action remains at this level to the open.
Not a problem. Every trading action results in creating another data point for a future entry.
Moving on to Biotech (IBB):
Using LABD (3X Inverse IBB) as the high-volume proxy, it’s oscillating in a narrow range and essentially unchanged.
Separately, David Quintieri at the Money GPS, comments here, that he’s being chided for not giving financial advice and not indicating which stocks to buy.
In addition, Steven Van Metre, in this report states the Dollar and 30-Year Bonds are shorted to unbelievable, historic extremes.
He also states that ‘when the market finally reverses, it’s going to be violent.’
The wipe-out, when it comes will likely be on several fronts.
Note: Posts on this site are for education purposes only. They provide one firm’s insight on the markets. Not investment advice. See additional disclaimer here.
If the trend is in-effect as shown, GLD could reverse tomorrow or in the overnight session.
The senior miners (GDX) stalled during today’s session. Price action is still at the Fibonacci 23.6%, retrace level.
To help clarify the firm’s positions, the following detail is provided as a courtesy only.
Several accounts are being managed. Currently there are two open positions in separate accounts (not advice, not a recommendation):
Managed Accounts
Detail Position Stop
Short GDX DUST 20.44
Short IBB BIS 25.46
Everyone has their own style. Ours adheres to tenets laid down by three market masters from the early 1900s. Detail on those criteria can be found here.
One of the reasons for choosing Livermore, Wyckoff and Loeb, is that no evidence exists these individuals were part of any full scale corruption or being the lap-dog for the globalist elite.
That statement is the complete opposite of what we have today. At this stage, the corruption and lap-doggery should be obvious to all.
Note: Posts on this site are for education purposes only. They provide one firm’s insight on the markets. Not investment advice. See additional disclaimer here.
That’s according to this episode from the Keiser Report.
Before we address that ‘report’, first this:
The video at this link (until it gets removed) is only 3:37 minutes long … but it explains everything.
It’s a well orchestrated script.
How else would every single major corporation have exactly the same advertisements?
Exactly the same; Literally, word-for-word.
So, bitcoin to replace gold? … it’s not even necessary to waste time with an answer. The deeper question is, what’s really going on with gold?
Gold is part of the script as well:
Gold is subdividing lower at this juncture.
One target level from this update puts it around the $1,300-area. By that time and if it gets there, the objective is met.
There will be few-to-none of the original bulls left to buy in … their money gone; used to pay bills, buy food or worse … bitcoin … right in time for a major solar flare to knock out the entire electronic grid.
Listen to the “Report” and how the big names are bandied about. They have the big bucks … you don’t. So, listen to them. They are the elite.
No, they are part of (and always have been) the coordinated effort to subjugate the masses.
It’s just now, there are enough ‘asleep’ with huge numbers of the population flu-shotted, vaccinated, fluoridated, medicated into complete stupidity; or just too afraid of the truth.
It’s not necessary to hide the message. What are you going to do … “elect” someone to change it? Got that one covered.
If you have read this far … yours is a different story. Welcome to reality.
One part of that reality is the markets are a wealth-transfer process which is now in overdrive.
Looking at the daily newsfeeds, it’s obvious (or should be) to the old-timers, the lies and miss-direction have gone to a whole new level.
Wyckoff’s admonition about listening to the news is more true now than a century ago.
Ignoring those news-feeds and focusing on price action, the initial analysis of gold and the miners from late October, was spot on.
The beginning trade in this series was a short position (via JDST) entered on Friday November 6th, when gold was at intermediate highs.
That short was held over a tense weekend.
Going against hundreds of thousands if not millions (on the other side of the trade) is difficult indeed.
Robert Prechter in his writings has detailed how hard it is to override the limbic (herd) system of the brain and operate separate from the crowd; nearly impossible.
By late Sunday – early Monday, gold futures (GCZ20) had collapsed.
The trade was closed out on November 9th, with a solid 13.22% gain.
Recognizing that JDST had more downward bias error than DUST, the next short position was initiated on the senior index (not advice, not a recommendation).
The GDX chart below (expandable version here) shows it’s following Fibonacci projections lower.
It would be nice from a profit stand-point for GDX to reach all the way to the 16-area (blue oval).
Even Steven Van Metre has indicated several times in his reports, this area is his target as well.
After all, who is going to listen to some guy whose wife made his “Like” and “Subscribe” flash-cards from cardboard and sticks?
Note: Posts on this site are for education purposes only. They provide one firm’s insight on the markets. Not investment advice. See additional disclaimer here.
The gold bulls are trapped and the market is eroding away.
The weekly chart of GLD (farther down), shows this past week was the opportunity for GLD to move higher.
It didn’t happen.
Some of the YouTube sites that are monitored, have caught on something’s very wrong with the bullish picture.
However, there are literally millions positioned (or at least thinking) on one side of the trade. Without neural plasticity to switch gears and re-position, at low risk no less, the pain is likely to be severe.
The same goes for the overall market.
Steven Van Metre, in his Friday update stated, ‘retail investors are all-in at the highest level in market history’.
Yet he says, the market did not move significantly higher. That’s the clue. It’s likely we’ve seen the highs.
There’s more middle class destruction on the way with shutdowns and restrictions; all under the guise of the speck.
If the speck is so bad, where are the bodies?
Take a trip to your local graveyard … you’ll probably find the caretaker asleep on his back-hoe … waiting like the Maytag repairman.
There are no bodies except for the odd duffer that died while on a ventilator … ah yes, the ventilator, that topic is for another time.
Those flexible enough, the entrepreneurs, picked up on this scenario long ago and have responded accordingly.
The only way out is self-employment; separate from the crowd. Even that’s no guarantee but at least it provides some time and flexibility.
Getting back to the markets, we see the S&P and Dow at their highs (possibly topping-out) while gold and the miners have already rolled over.
Senior miner index GDX, has now posted an outside down (key reversal) on the monthly chart.
We have one more trading week to go (plus one day), but it’s likely the key reversal will stick.
As always, even with the lower action just passed, upward movement next week (if any) could happen but it’s likely to be halting and laborious.
If the overall markets head lower, the uneducated public once again and by their own actions, have set the stage for their financial destruction.
Only this time, it’s over. There will be no recovery.
As the downturn sets in and jobs continue to disappear, the calls to ‘make it stop’ will become ever so shrill.
The masses will be desperate enough to line up for government assistance and allow (even beg for) the catch … be injected first; No matter who is in office.
There’s a reason, professional, seasoned hard as nails (even profane) market traders are quoting Biblical scripture.
Note: Posts on this site are for education purposes only. They provide one firm’s insight on the markets. Not investment advice. See additional disclaimer here.
Some of them realize the error, get themselves righted and back on the direction of trend. Others, like in one Livermore example (the cotton trade) go bankrupt.
Just to see how big the hyperinflation crowd is, we’ve added up the total number of subscribers to bullish YouTube channels listed in this update.
That list for sure, is a small fraction of bullish ‘content’ available. At a total of 674,000 subscribers, it’s already a huge number. The actual size of all such content is most likely in the millions.
Note the word “content”, is amorphous. It just means ‘there’s something in there’. It does not mean that ‘something’ is of any use.
When reading through the old trading stories, we see the great speculators operated alone. At times, they employed a support staff of ‘board boys’, writing quotes down on the chalk boards but not much else.
If you’re alone, direction changes happen instantly. Changing direction that fast for millions … not a chance.
At this time in the pre-market (9:03, a.m. EST), gold (GLD) is set to open lower with GDX indicating lower as well.
Looking at the chart of GDX, we’ve got a possible trend line.
Such lines make things a bit easier. If there is confirmation on the way down, we maintain the DUST trade (not advice, not a recommendation); until the trend is broken.
Current stop (not advice, not a recommendation) is set at DUST 18.92
Note: Posts on this site are for education purposes only. They provide one firm’s insight on the markets. Not investment advice. See additional disclaimer here.
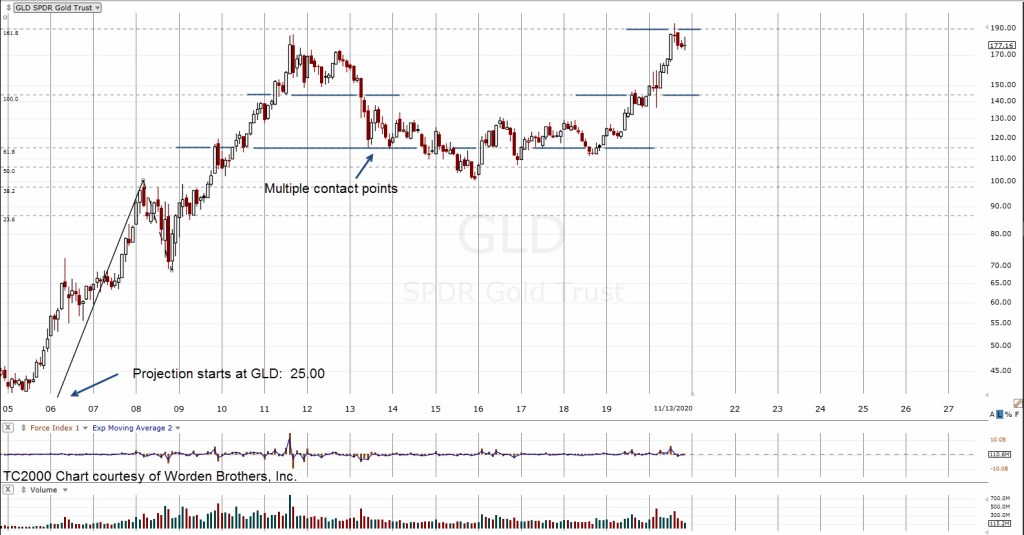
Using that knowledge, we can create a Fibonacci projection tool for the chart of GLD.
The GLD data on the chart does not go back that far. So, we have to improvise.
Taking the Fib projection tool down to the 24 – 25 area of the chart and then identifying a major top of the move during the financial crisis of 2007 – 2008, gives us the chart shown below.
Note the multiple price action contact points on the 61.8 projection. This area is an axis line. The market oscillated around this area for nearly 10-years, before heading on to new all-time highs.
The axis lines and reversal points on the chart provide confirmation we have selected the price action waves correctly.
Using the same 25-area on GLD, we’re gong to remove the projection tool and use the retrace tool and then zoom in using the weekly chart.
That chart is below:
There is a lot going on with this chart. Note the wide, high-volume bar. Volume for that week was about double from the week prior.
Markets tend to go back to these areas for a test.
That area also represents a Fibonacci 38.2% retrace of the entire move off the February 2001, lows.
On top of that, a retrace to GLD 130, is a near exact -33% from the highs.
If that weren’t enough, price action getting to that level would automatically set-up a Wyckoff spring (reversal) condition by penetrating the support area shown.
Will this all happen? Obviously it’s unknown at this point. However, it does give us context.
As always, price action is the final arbiter. We’re short on the GDX, the Major Miners via DUST (not advice, not a recommendation). Our original stop was probably too tight at just 0.41 points from entry.
We’ll see how it works out. Certainly, we are at another danger point.
Stay Tuned
Note: Posts on this site are for education purposes only. They provide one firm’s insight on the markets. Not investment advice. See additional disclaimer here.
Deflationary impulse is a term that is used to describe the potential decline in gold and silver prices.
If that’s what’s coming, it looks like it’s already started.
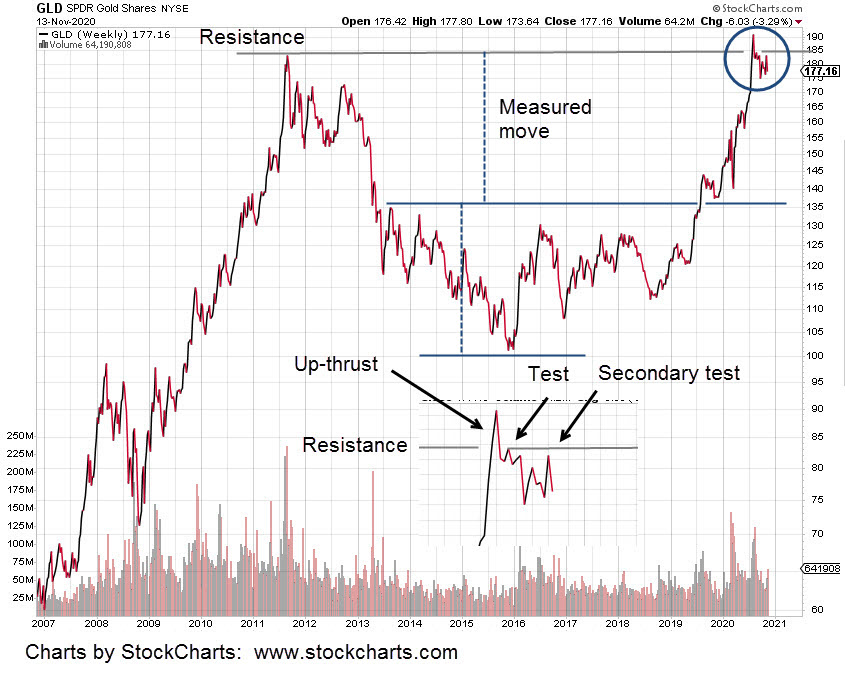
The weekly chart of GLD below, shows the long-term action in the sector.
We have a trading range that formed during 2013 – 2019. That range gave a projected ‘measured move’, to the 185-area for GLD.
The target has been met. The bullish trade is over and now something else is being created.
That something from the circled area shown, expanded at the bottom of the chart, appears to be a reversal (Wyckoff up-thrust) condition.
The up-thrust was tested early in the reversal (first arrow) and this past week looks like a secondary test. Secondary tests do happen. Not too often but its acceptable market behavior.
In the updates here and here, the overnight futures price action was used to determine this past Friday, 13th, was a 38% retrace of the most recent down move; indicating weakness.
Anything can happen. GLD could open higher on Monday and somehow power its way through the down-trend line shown in Friday’s update.
However, probabilities based on the combined analysis point to continued downside action.
If we get a decline, how far would it go?
Price action permitting, we’ll cover downside targets in the Monday pre-market update.
Note: Posts on this site are for education purposes only. They provide one firm’s insight on the markets. Not investment advice. See additional disclaimer here.