Ruh, Roh: Bond Reversal

Now, it gets interesting.

Bonds sold short the most in history.

Then, today’s action is reversal with moderate volume.

On the dollar side, at first glance it looks like a terrible day.

Action was down 0.53%.

The reality is, UUP came down to test an up-trend line formed as part of its own reversal last Thursday.

Both dollar and bonds are in an upside reversal; the dollar looks slightly ahead by a few days.

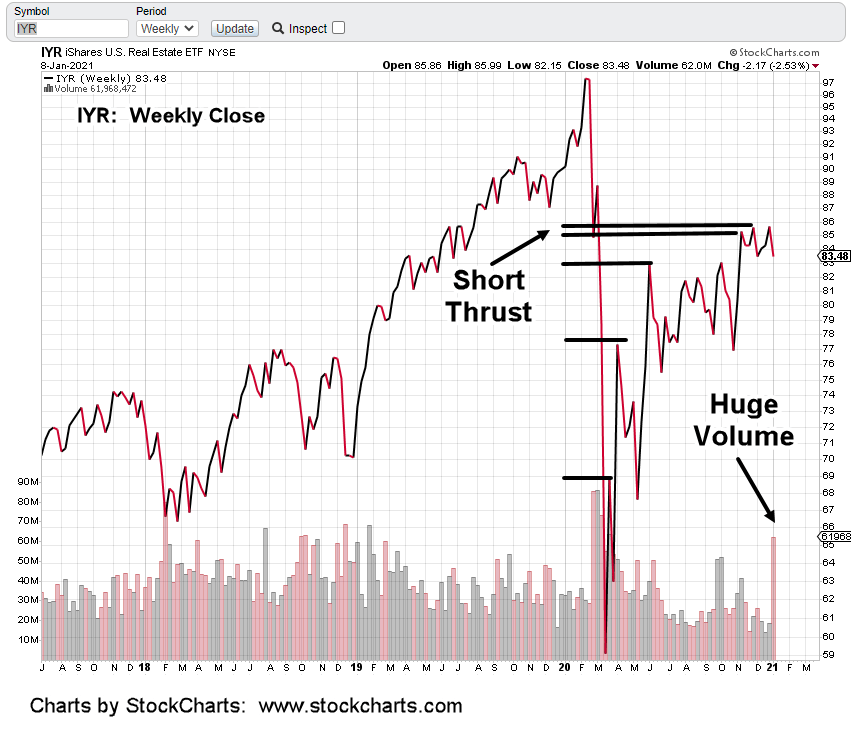
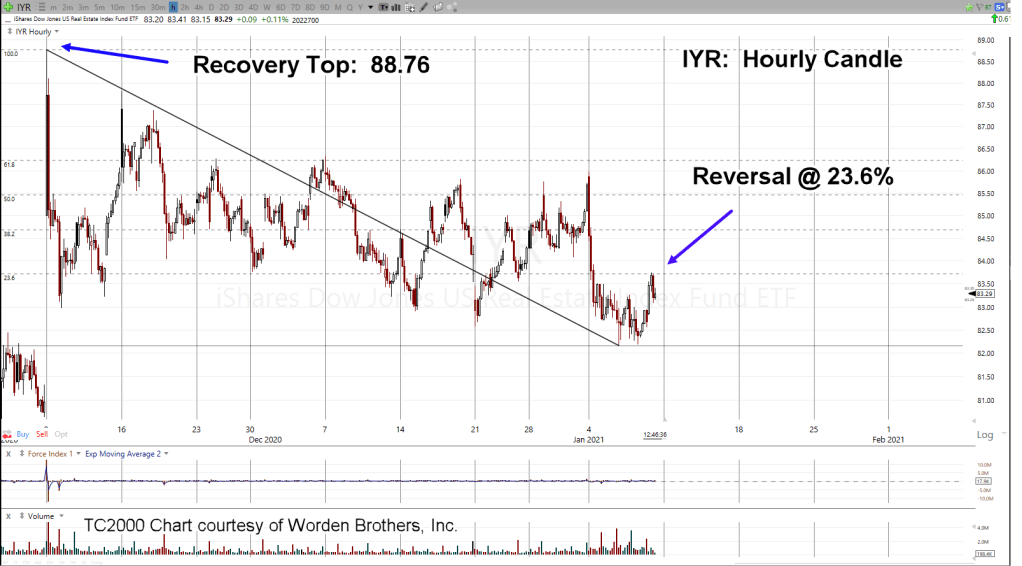
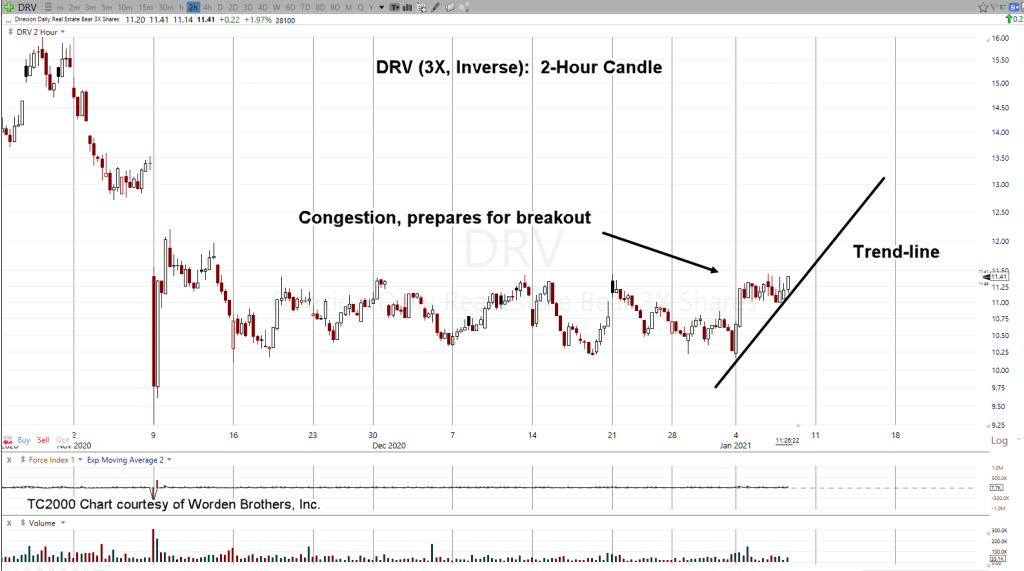
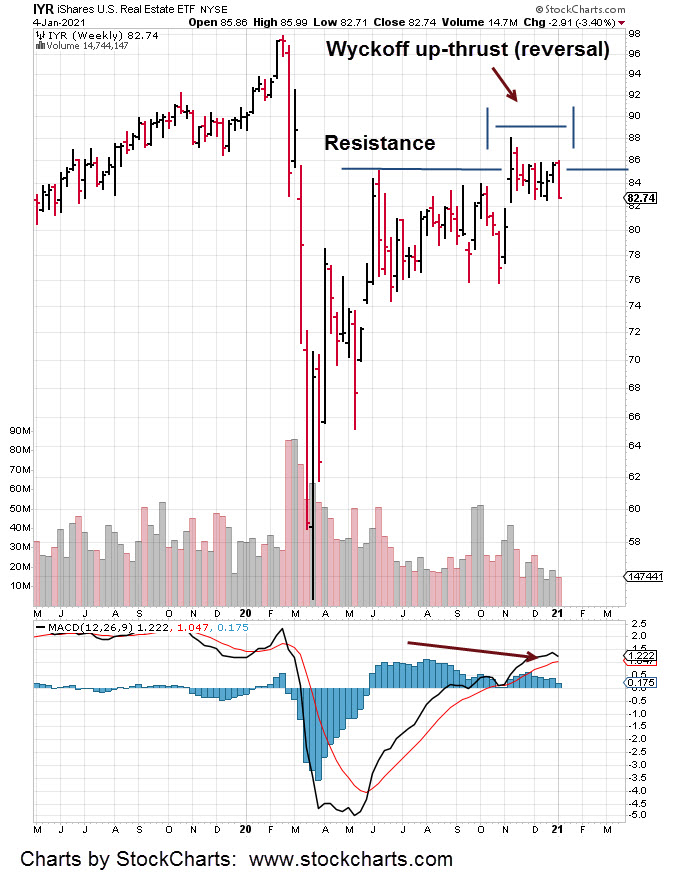
Real estate (IYR) has rallied (sort-of) which may only be temporary; likely on the (false) belief lower bond yields are good for higher yielding sectors.

Not true when we still have (as Van Metre puts it), the ‘insolvency event’ yet to come; everyone going bankrupt all at the same time.

Anything can happen and the above analysis could fall apart tomorrow.

On the probability side, looks like we’ve seen the extremes in the major sectors; now ready for reversal pivots.

Note:  Posts on this site are for education purposes only.  They provide one firm’s insight on the markets.  Not investment advice.  See additional disclaimer here.

Real Estate: Sleepy & Quiet

At least that’s the way it looks right now.

Under the radar, the sector (IYR) may be getting ready for a dramatic break lower.

The chart above is the 3X inverse fund DRV (inverse of IYR).

The table shows entries over the past few days; not advice, not a recommendation. Currently, the firm has no other open positions.

Early in this morning’s session, IYR posted a new daily low with DRV conversely, posting a new daily high.

At this juncture (11:23 a.m. EST), we’re in a very tight range (both tickers, IYR, DRV) that’s oscillating in an attempt to determine the direction of least resistance.

From a weekly momentum standpoint, MACD has been positing lower for two weeks and is near a zero crossing.

With that, we’re favoring the downside for IYR and upside for DRV.

The market’s hovering at all time highs … effectively masking the fact, air is going out of IYR.

Charts by StockCharts

Note:  Posts on this site are for education purposes only.  They provide one firm’s insight on the markets.  Not investment advice.  See additional disclaimer here.

Real Estate: Subdividing Lower

Lower highs, lower lows, real estate (IYR) is subdividing.

The weekly close (above) has upward thrusts getting shorter, stalling out, then reversing.

Note the massive volume; up over 234%, from the week prior.

Drilling down to the daily, price action rose slightly (last Friday) to close just under the axis line.

We’re still below the 23.6%, retrace as reported here.

Volume evaporated on the session; declining 60% from the day prior and indicating not much interest to the up-side.

This is the danger point where the risk is least. If price action continues higher from here, it’s possible IYR may attempt a new high.

Price action declining (more probable), indicates the pivot’s in place.

Right now, bonds are stretched; ready to reverse along with the dollar.

Those two markets may put the kibosh (big time) on risk assets if they short squeeze.

Recall that IYR did not follow the rest to new highs. For months, it’s been languishing, building congestion.

Stay Tuned.

Charts by StockCharts

Note:  Posts on this site are for education purposes only.  They provide one firm’s insight on the markets.  Not investment advice.  See additional disclaimer here.

Real Estate Dead

As markets power higher, real estate topped last November; its been dead ever since.

IYR is telling us something. That something may be it’s about to be one of, if not the leader to the downside.

The last report said IYR is breaking down. This morning’s action was an upward test, then reversal.

Testing at Fibonacci 23.6%, (shown above) then reversing indicates severe weakness.

Inverse fund DRV (3X inverse IYR) is moving back into its prior trading range (11.00 – 11.50) after pushing lower in the early session.

Today could be the day. The day were real estate (IYR) begins a dynamic drop to much lower levels.

Note:  Posts on this site are for education purposes only.  They provide one firm’s insight on the markets.  Not investment advice.  See additional disclaimer here.

DRV Trend-Line

DRV is the 3X inverse tracking fund for real estate, IYR.

Price action is now breaking higher (IYR, lower).

The 2-Hour chart of DRV (above) shows the trend.

There’s always a chance price action at the trading range lows in IYR, is a potential reversal to the upside.

With the overall markets at new highs, and IYR dead-in-the-water, probabilities favor downside action (DRV higher).

Note:  Posts on this site are for education purposes only.  They provide one firm’s insight on the markets.  Not investment advice.  See additional disclaimer here.

Real Estate First?

Real estate IYR, may be leading the way down

Price action has been at the lows for three days and not retracing higher.

The overall markets are at all time highs … IYR can’t seem to get going to the upside.

Well traded inverse funds for IYR are SRS (2X inverse) and DRV (3X inverse); not advice, not a recommendation

Charts by StockCharts

Note:  Posts on this site are for education purposes only.  They provide one firm’s insight on the markets.  Not investment advice.  See additional disclaimer here.

Real Estate, Ready?

The real estate index IYR has been struggleing at resistance for months.  Yesterday’s action was a swift break lower to the bottom of the range.

Inverse fund DRV (3X inverse IYR) had is largest single day gain since mid-May of last year.

The weekly chart shows the four-month struggle at resistance as well as MACD bearish divergence.

IYR may attempt to test slightly higher (DRV down) during this session.

If so, we’ll be looking to position short via DRV; not advice not a recommendation.

Moving on to biotech.  Yesterday’s action was a good example of negative bias in LABD.  Even though IBB closed lower, LABD closed lower as well.

The LABD position was closed out as shown (above) and the BIS positions maintained.

Note the R-Exit value.

This represents the gain on the amount risked. If $1,000 was risked on the trade, it returned $8,540.

Update will be forthcoming if/when a DRV position is established.

Charts by StockCharts

Note:  Posts on this site are for education purposes only.  They provide one firm’s insight on the markets.  Not investment advice.  See additional disclaimer here.