Will The SOXX Buck The Trend?

Pre-market action (as of 8:03, a.m., EST) in the SOXX is higher at 229.48, but below yesterday’s print high (SOXX 231.02)
During sustained uptrends, and by not printing a new daily low (SOXX 223.62), puts the SOXX in a potential bullish set-up (not advice, not a recommendation).
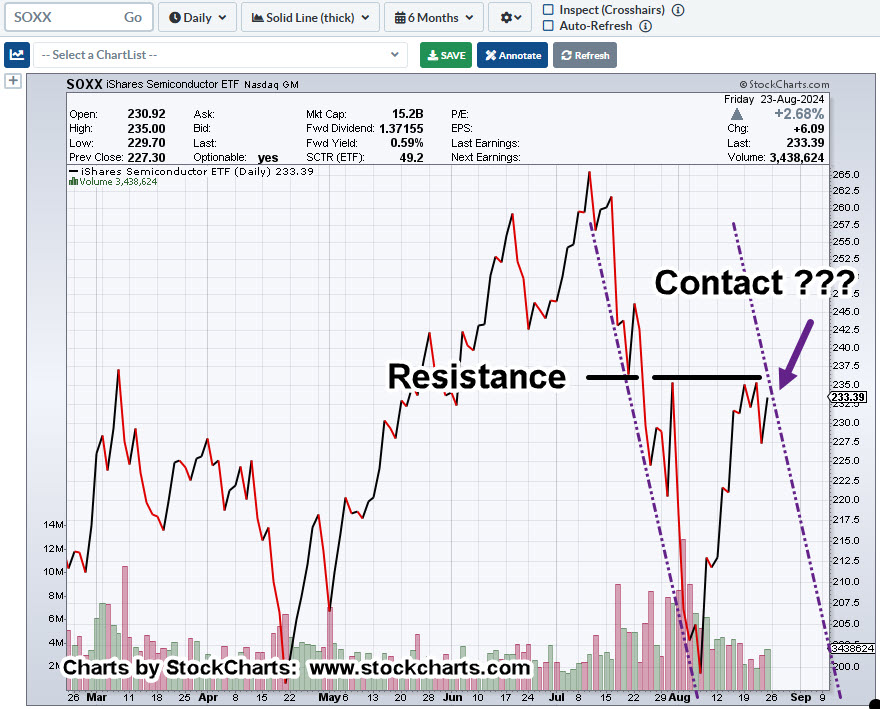
However, at the same time, we’ve hand what could be considered an initial leg down from all-time highs on July 11th, to lows, August 5th, then a corrective rebound, where we are today.
As we’ll see below, there are two scenarios … the ‘red’ pill and the ‘blue’ one.
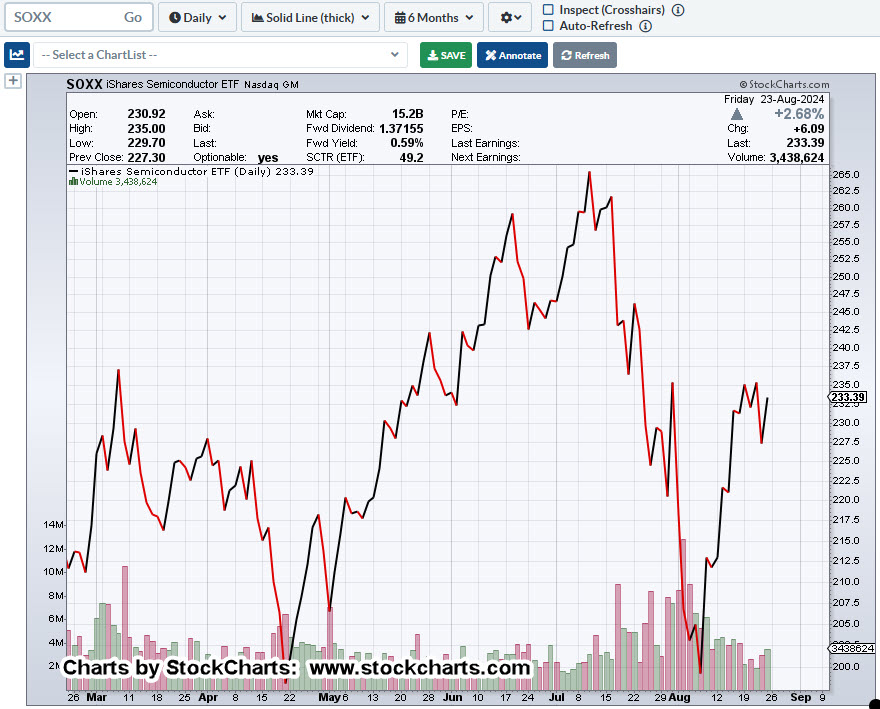
Semiconductors SOXX, Daily
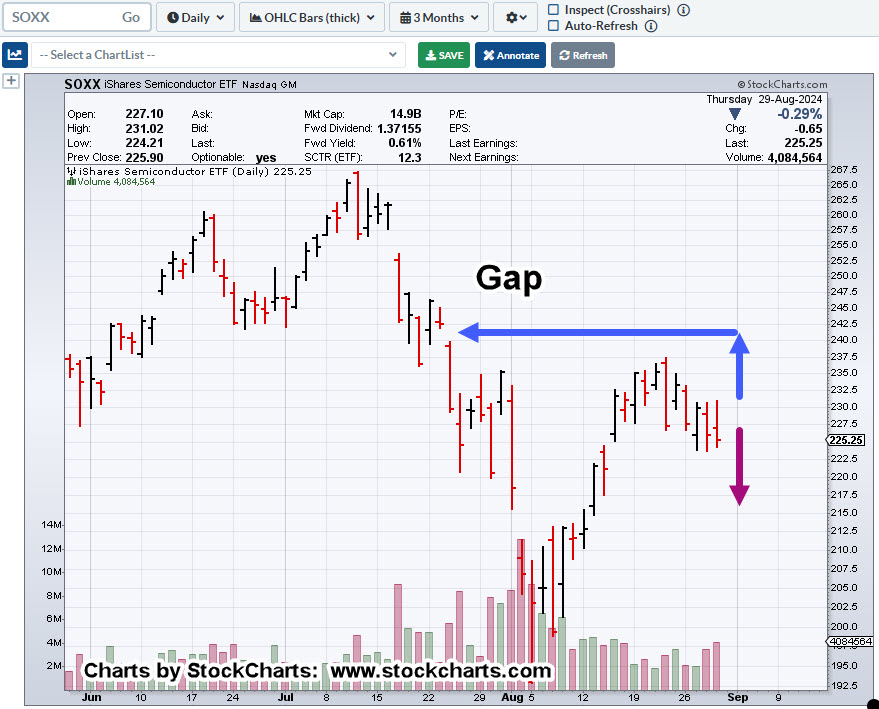
If the SOXX, posts a new daily high the short, SOXS-24-14, will be exited (yet again) to stand aside for the potential gap-fill (not advice, not a recommendation).
From a trading standpoint, it’s not unusual to ‘spend money’ to get into position if the potential reward is large enough.
Note, there has been no ‘money spending’ yet, as the last short trade SOXS-24-13, was profitable by about +4.9%
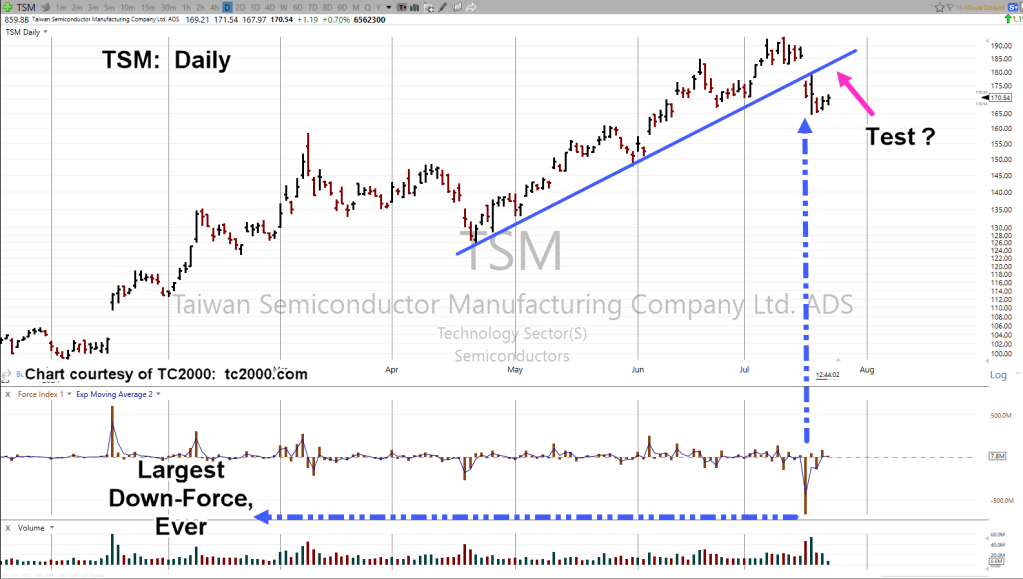
With the potential reversal of the largest bubble in world history, one could consider the downside opportunity in the SOXX, to be significant. 🙂
Stay Tuned
Charts by StockCharts
Note: Posts on this site are for education purposes only. They provide one firm’s insight on the markets. Not investment advice. See additional disclaimer here.
The Danger Point®, trade mark: No. 6,505,279