SOXX, Off-The-Cliff
Just two days ago, was this (emphasis added):
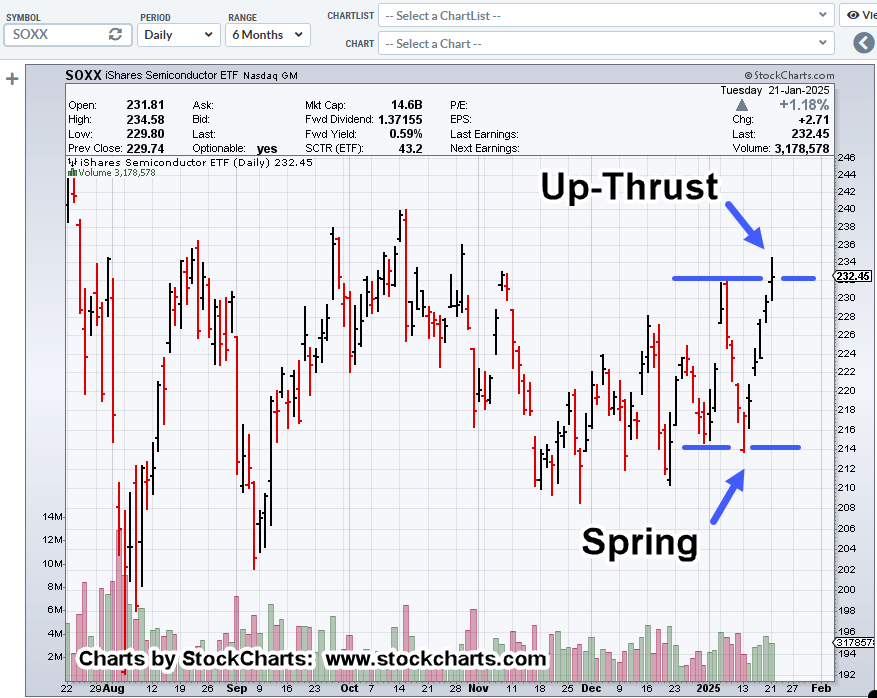
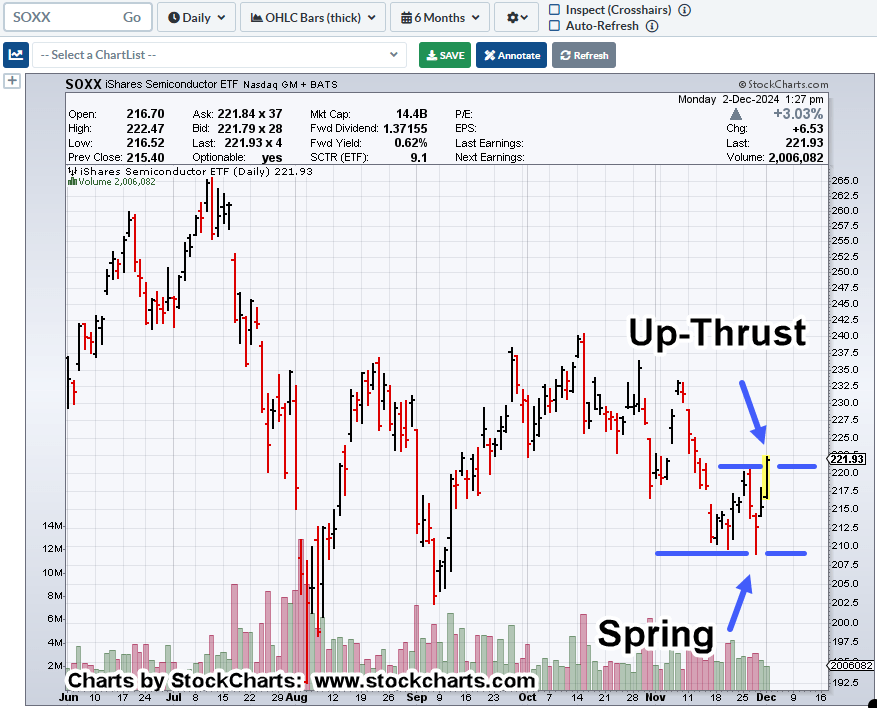
“The chart below, presents a possible ‘last gasp’ for the SOXX.”
Four days before that, was this:
” … what is shown, is a repeating phenomenon; Wyckoff, Spring-To-Up-Thrust.”
In effect, Wyckoff analysis gave us a ‘head’s up’ nearly a week ago, the SOXX may be about to reverse.
That was plenty of time to decide whether to position short or stand-aside (not advice, not a recommendation).
Now, this morning the (tech) market’s in a panic.
Over-the-weekend news about threats to Nvidia’s lock on A.I., with this and this resulted in futures opening lower Sunday night.
Then it got worse, link here.
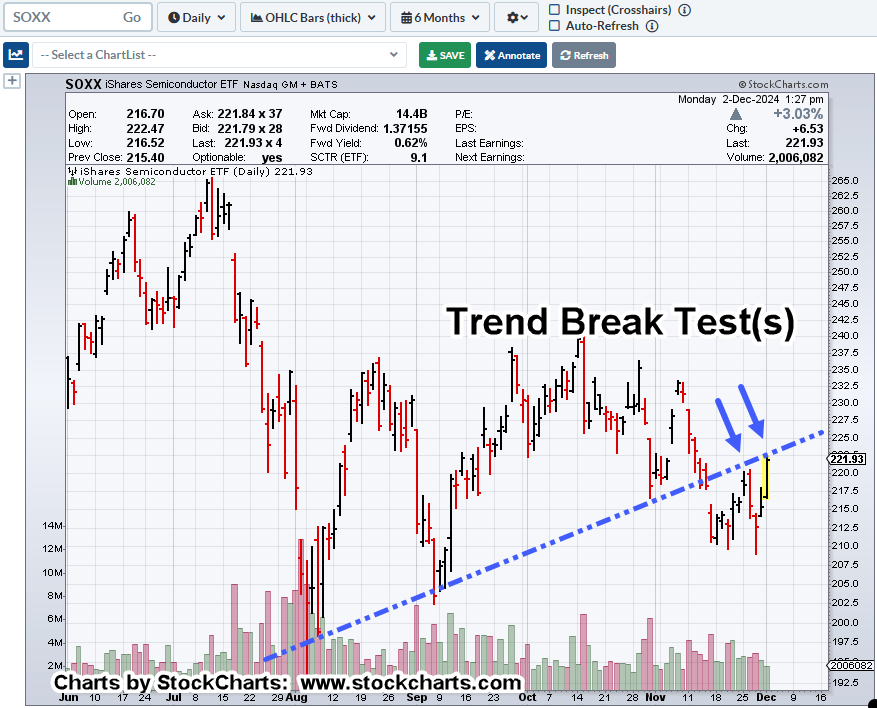
Semiconductors, SOXX, Daily (line/close)
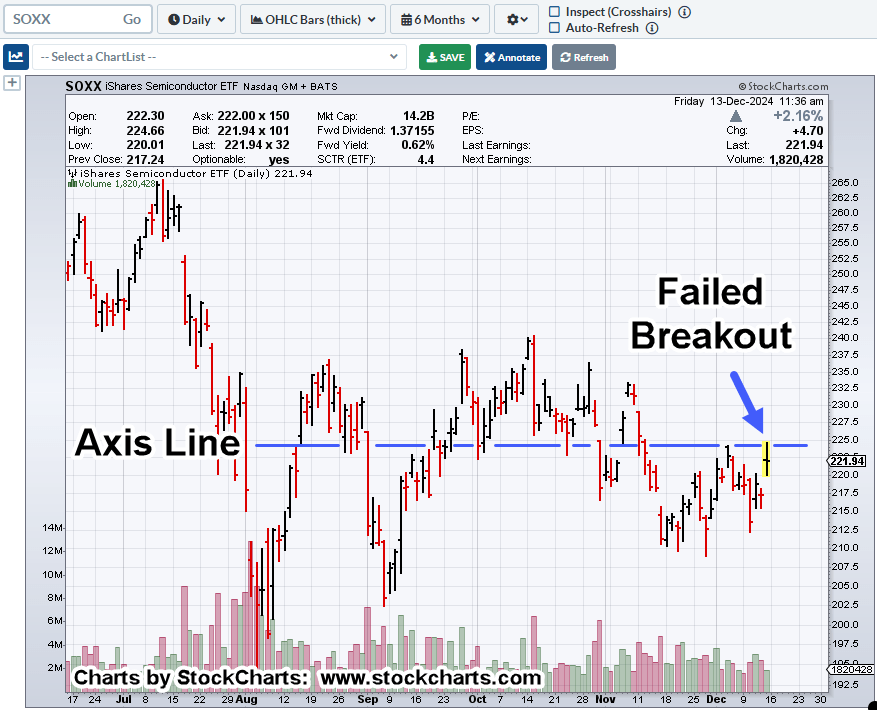
Let’s start first, with the last update.

Now, updated as of 10:53 a.m., EST.

On the daily bar-chart (not shown), we have a massive gap-lower open.
Will that gap be filled or is this a real breakaway and the start of a long-sustained bubble deflating decline?
That of course, is unknown.
What is known and presented on this site, Wyckoff analysis, with its century old technique, spotted the potential for reversal well ahead of the actual fact (not advice, not a recommendation).
Final Note
As the sidebar shows, since the beginning of this year, there have been several attempts to position short in the SOXX via leveraged inverse fund SOXS.
Trades SOXS-25-01 (not discussed), and SOXS-25-02, were first, then closed, with trade SOXS-25-03, opened last Friday (not advice, not a recommendation).
Stay Tuned
Charts by StockCharts
Note: Posts on this site are for education purposes only. They provide one firm’s insight on the markets. Not investment advice. See additional disclaimer here.
The Danger Point®, trade mark: No. 6,505,279