Biotech Breakdown

Biotech is breaking down, now.

For this firm, going short has been an on-again, off-again, back on-again affair.

Fotosearch_k16630038-borderThose with engineering degrees (including this author) or some other science degree, would have decided long ago, since the original entry’s not perfect (being stopped out), the idea must be wrong.

Others easily distracted (those with i-phones) would have given up as well … only to see their (short) premise come to fruition without them.

So, here we are.  Biotech (IBB) is breaking down with inverse BIS moving higher while the overall market continues to rise.  As of this post, the S&P 500, is up 25-points or about +0.75%.

The chart and the expanded insert, show trading activity over the past two weeks.

2020-08-24_10-04-52-BIS-Daily-5-bar-notes-insert-notes
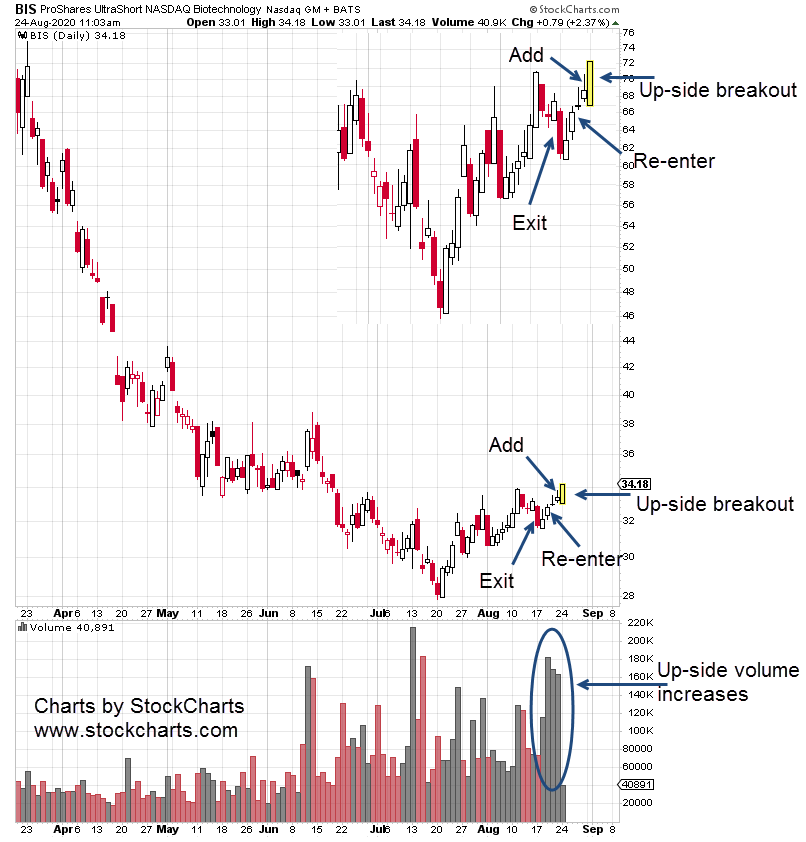
Prior to the ‘exit’ point shown, we’re positioned long BIS (short biotech).  Then, price action broke down through the prior day’s low.  BIS was exited entirely.

Almost immediately after the break, the down-side price bar was challenged with up-side action.

After that, next day saw even more upside.  When new daily highs were posted, BIS was re-entered.

Two days later, last Friday, the trade was increased by 7%.  Just topping it all off for what amounts to a full position.

Since we’re using trading techniques from early masters, the last two months or so, mimic actions that may have been taken by Livermore or Wyckoff.

Not saying we’re in the same league as them.  Just saying based on their writings, the approach mimics documented trading behavior in the markets of their time.

At this point and being fully positioned, we wait.  Livermore put it as:  “Get right, and sit tight”.

An obvious stop level is anything below today’s BIS low of:  33.01.


Charts by StockCharts

Note:  Posts on this site are for education purposes only.  They provide one firm’s insight on the markets.  Not investment advice.  See additional disclaimer here.

Is Corn The Catalyst?

Bonds, biotech, the banks; or is it corn that’s the catalyst?

Everyone’s focused on the markets, the S&P 500.

Fotosearch_k8956751Meanwhile, back at the farm (literally), the food supply is undergoing controlled demolition.

If the supply chain continues to be restricted with prices rising ever higher, the silver and gold ‘stackers’, may have to liquidate their hoard just to survive.

Getting back to corn; the technical position of the ETF, CORN was highlighted yesterday in this post.

Now, with about an hour before market close, CORN has posted a 38% retrace and reversal ( if close is at or above current levels).

On top of that, it may be too early but maybe not.  CORN is now trending upward at over 400%, annualized.

One day, does not a trend make.  Then again, wouldn’t it be nice to know early on of the possibility?

2020-08-20_13-42-53-CORN-Daily-4-bar-notes

Charts by StockCharts

Note:  Posts on this site are for education purposes only.  They provide one firm’s insight on the markets.  Not investment advice.  See additional disclaimer here.

Shorting The Bond Market

Who goes first?  Do bonds break to the downside, rates up, market reverses lower into a potential crash; a-la October 1987?

Or, does the market (S&P 500) peak and reverse with a flight to safety (bonds) that mitigates or negates a sharp rise in rates.

Fotosearch_k6354877
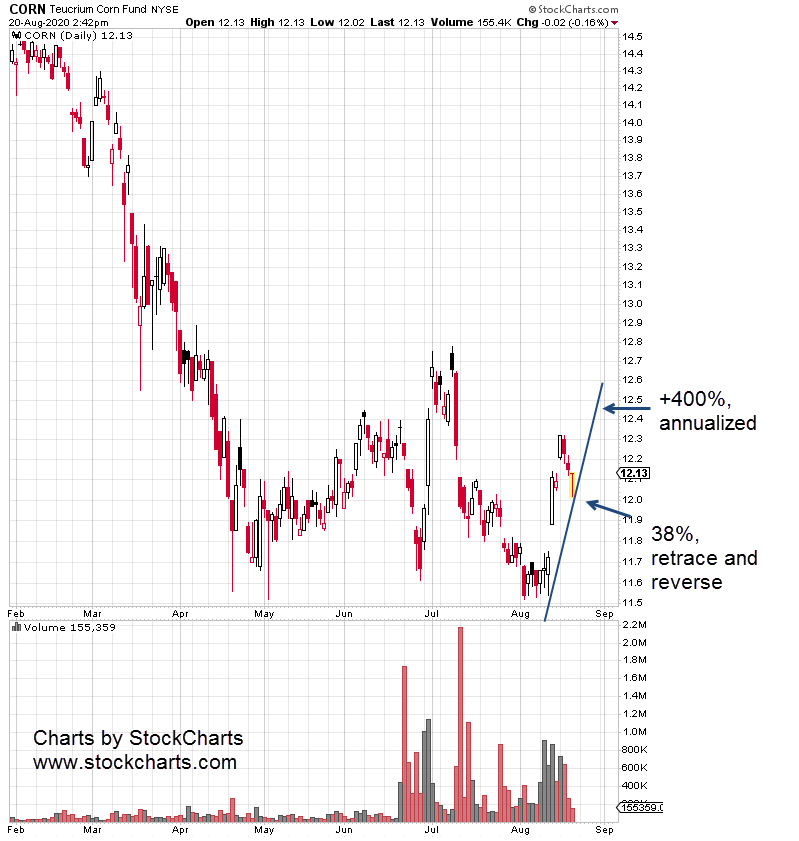
Maybe it’s stocks and bonds going lower together.  No safe havens.  Is it possible?

Early this session, the ten-year rate (inverse of bonds), is hovering just below the trend-line shown in the last post.

The bond bull market has lasted forty years.  Since 1980.  Obviously, at some point, it’s over.

With long bonds (10-yr, 20-yr) hovering near a breakout to lower levels, all it would take is some kind of ‘event’ to tip the scales.

Remember that Prechter  (no matter what you think of him) said years ago, the market leads the news … not the other way around.  It’s a complete mind-shift to understand that market position, price action, actually set the conditions for news events.

The market does not ‘react’ to the news, it ‘creates’ the news itself.  So, the bond market may be about to create an event.

With that in mind, inverse fund TBT attempts to give exposure to twice the downside of the 20-year bond.

In a nutshell, if the long bond moves lower, TBT moves higher at approximately twice the percentage amount.

The chart of TBT is below and it looks very similar to the $TNX chart in the prior update.  Looking closely, one can see the downward bias errors.  With each move lower in the $TNX, the TBT moves lower still.

It’s common with all inverse funds.

2020-08-17_9-07-32-TBT-Daily-3-bar-notesEffectively trading TBT requires a sustained down move in the corresponding market (to mitigate the down-bias).  The latest example shows bonds ready to break lower with rates ($TNX) moving higher.

TBT could be in a position for trade entry (not advice).

Additionally, if bonds break decisively lower, they have potential to stop dead what’s left of the economy:  Housing market, lumber market, building construction, and on.

Remember ‘the speck‘.  It’s all about the speck floating through the air.

On a separate topic and as a courtesy (not financial advice), the short position in biotech via BIS, was closed early this session as price action hit the pre-determined 8.15, stop.

Gain on the overall short position was about 5%.


Charts by StockCharts

Note:  Posts on this site are for education purposes only.  They provide one firm’s insight on the markets.  Not investment advice.  See additional disclaimer here.

Bonds Critical

The 10-year bond has reversed.  Rates are moving higher.

Fotosearch_k0005935-borderIf the chart pattern (below) is in effect, if price action moves according to the breakout forecast, real estate … along with lumber prices, as well as the entire economy could experience a series of dramatic ‘air pockets’ all-the-way-down.

Of course, all of this is because of a little ‘speck’ floating around in the air.

Rates are at the wedge trend-line and instead of a breakout upward (as expected), could reverse back lower.  Anything can happen.  The next week is likely to be very interesting.

2020-08-16_8-43-46-TNX-Daily-3-bar-notes


Charts by StockCharts

Note:  Posts on this site are for education purposes only.  They provide one firm’s insight on the markets.  Not investment advice.  See additional disclaimer here.

September, 1929

The stock market peaked on September 3rd, 1929, the Tuesday after the Labor Day weekend.

Labor Day for 2020, is Monday, September 7th

The bond market has posted a double top and reversed.  Rates are moving up.

Now, the stock market is stretched, extended and rates are rising; similar to August 1987.

Antique-Ticker-borderThe problem is, it’s similar by an order of magnitude or more.

Remember in the most recent downturn, there were trading halts, brokerage server blow-ups and customer accounts going completely off-line.

In that situation, if someone is long and expecting to beat the herd on the way out, good luck.

The firm sponsoring these updates and analysis stopped trading the (equity) long side of the market years ago; recognizing at any moment, the entire system could break-down with any open positions effectively locked.

If there’s another large break with orders, positions, accounts ‘trapped’, for hours or possibly days; who wants to be on the long side of the market?

Downside Leader

Two months ago in this post, the idea was floated that biotech, IBB may be the downside leader.

It certainly didn’t look like it at the time.

Biotech even went on to make a new high … potentially negating the theory.

shutterstock_146355983It’s different now.

After that new high, IBB has reversed and is trending lower.

On the other hand, the overall market, S&P 500, continues its push upward.

It’s within 1% of all time highs.

Pre-market action as of this post, has the S&P opening up about 0.4%, higher … ever closer.

At this juncture, biotech has hinted at downside leadership.  That hint my become a solid fact if and when the S&P has a decisive downside reversal.


Note:  Posts on this site are for education purposes only.  They provide one firm’s insight on the markets.  Not investment advice.  See additional disclaimer here.

Upwards, Sideways & Down

Fotosearch_k8916628-1That’s the direction of the Dow Jones 30, the S&P 500 and the Russell 2000.

Intermediate and advanced trading professionals understand what this means.

When a market has experienced a long, sustained advance that may cover months and years … near the end of that advance and just prior to the ultimate top, the market thins out.

That’s the process whereby fewer and fewer stocks are participating in the advance.  Essentially, the bear market has already started as more and more stocks fall away from the uptrend.

In fact, ZeroHedge just reported the S&P 500 in its narrowest (11-day) closing range in history:  An unprecedented event.

Now that we appear to be at the upward extreme, what happens next may be unprecedented as well.

____________________________________________________________________________________________

For technical analysis on individual stocks, markets or indices, please visit our parent site at www.ten-trading.com


“Buckle your seat belt Dorothy ….

’cause Kansas is going bye – bye.”

If there’s a spot for the market to reverse, this is it.

2016-11-28_15-32-29-spy-weekly-notes-1


With markets at stretched, bloated and obscene valuations (as reported by David Stockman), we even have an article that tells us the bull market is just getting started.

Well, anything can happen but false narratives abound at the extreme end of a trend.  A ‘new bull market’ could very well be false.

In depth technical discussions of the S&P and other markets are on our corporate site located here.

The bottom line is, we might already be on the ride … to much lower levels.


Charts produced by TC2000 which is a registered trademark of Worden Brothers, Inc., P.O. Box 1139 Wilmington, NC 28402.  Ph 800-776-4940 or 919-408-0542.  www.Worden.com


Coiled Spring

While the market looks dull, it’s actually coiled up like a spring ready for its next move.

The best analysis we have found thus far, is the quote below.  The analyst states that price action looks like a pendulum swinging down to rest.  We’re in a brief period of dull market activity.

“These dull periods often occur after a season of delirious activity on the bull side.  People make money, pyramid on their profits and glut themselves with stocks at the top.  As everyone is loaded up there is comparatively no one left to buy, and the break which inevitably follows would happen if there were no bears, no bad news or anything else to force a decline.”

Indeed, it’s an excellent assessment of the price action in the S&P as seen below.

2016-10-08_9-23-04-spy-daily-close-coiled-spring-notes

The problem is, that analysis was not written this past Thursday or Friday.  No, that assessment was written over a century ago in Wyckoff’s seminal text:  Studies In Tape Reading.

To understand the present, we need to understand the past:  especially with stock market activity.

The human condition has not changed since inception.  There’s no new ‘quant’ program that has it all figured out.  If that were true, price action would look different.  We would not be able to use century old techniques to call market turns to-the-day (repeatedly) as detailed here and here.

The only media mention of Wyckoff that we’ve ever seen is a brief reference by Linda Bradford-Raschke (former pit trader) at this link.  At time stamp 0:36, she mentions Wyckoff.  It almost slips by for those not attune.

  • If the pit traders know where to go for guidance, should we not do likewise?

As we come forward one hundred years, we see the S&P has coiled itself like a spring.  For the past seven-plus years, it’s been delirious bull market activity as Wyckoff stated.

Traders and investors have continued to gorge or force themselves on every last up-tick.  The market has now come to rest apparently unable to move higher.

What new catalyst will come to the fore to launch to higher levels?  It could happen:  However, the most probable resolution of this formation is a move to the downside.

References:

Wyckoff quote from Studies In Tape Reading.  Used with permission from Cosimo Classics.

Charts produced by TC2000 which is a registered trademark of Worden Brothers, Inc., P.O. Box 1139 Wilmington, NC 28402.  Ph 800-776-4940 or 919-408-0542.  www.Worden.com