A Long List, At That

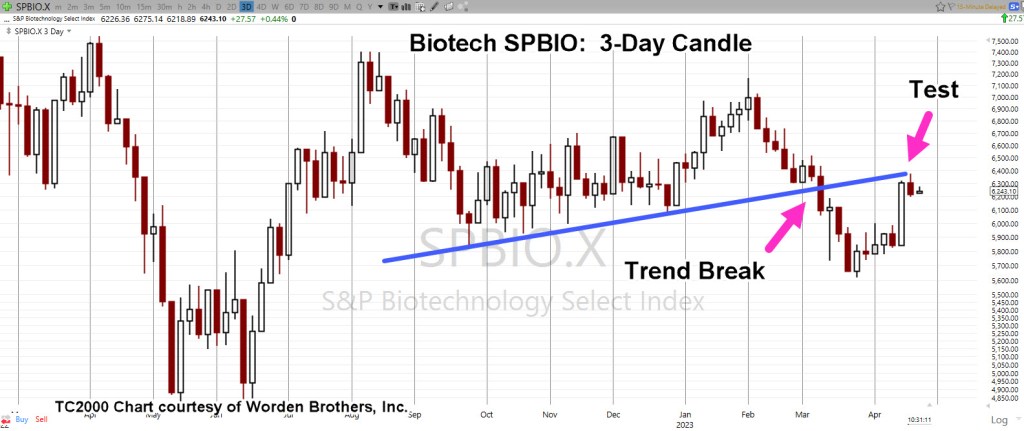
The prior analysis of biotech SPBIO, had expectations for price action to rise into the 6,400 area: the location of the 200-Day Moving Average.
It did that, and more …
Back in late April, SPBIO, was in a Fibonacci time sequence. Shown below, that time structure may still be intact.
But First … The List
Note: This is not “The List“, as has been compiled (still on-going), covering the horrors of this sector but rather a list of reasons why SPBIO, is likely to head lower from here.
Here it is, not in any particular order:
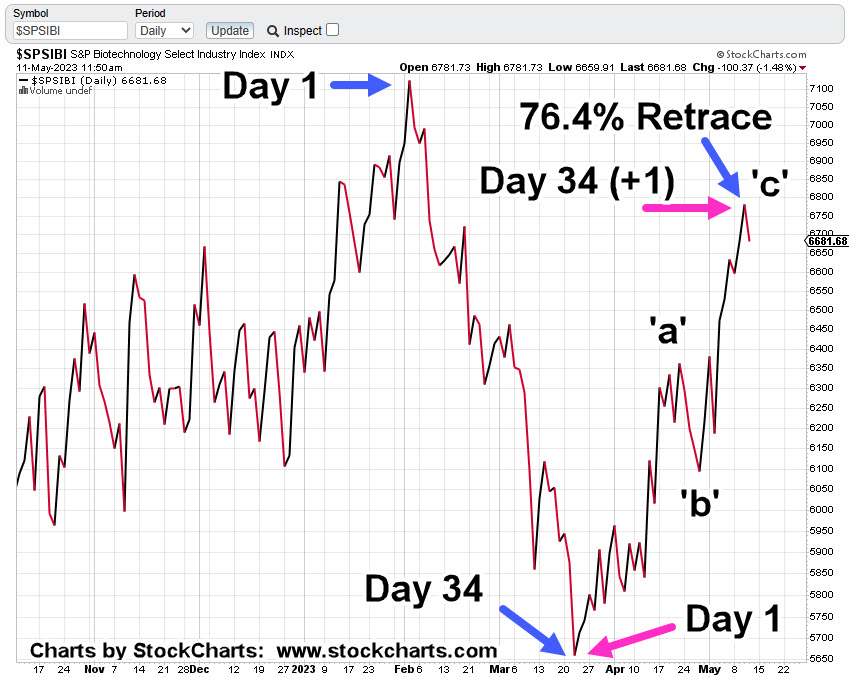
Price action has reached a Fibonacci 76.4%, level
From the March 24th low, price action has retraced upward in an ‘a-b-c’ corrective move, with wave ‘a’ distance equal to wave ‘c’. Note: Equal distance ‘a’ and ‘c’, on a print basis.
At the last session, as the action pushed to a new daily high, there was ‘evidence of a struggle’ during the session to either reverse lower or move higher. Action was undecided and closed slightly below the open.
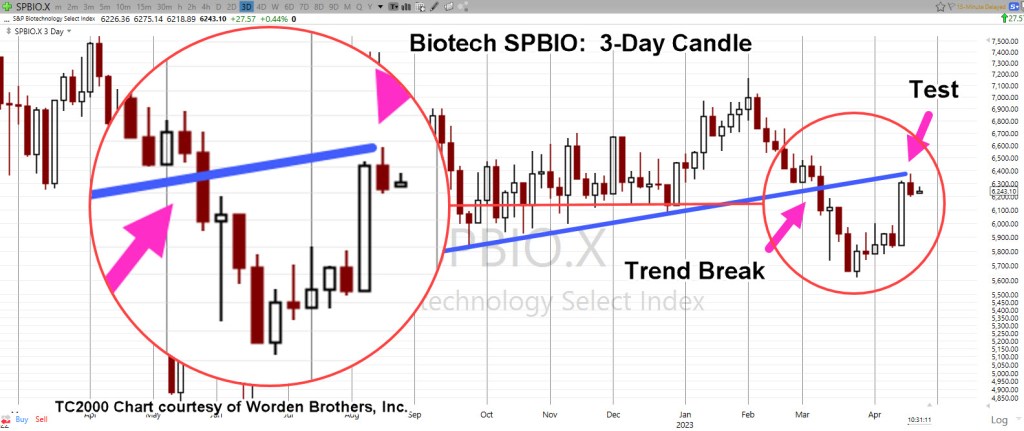
Looking at the first chart below, the daily close for the past three-years has the trend decidedly down; this sector is the weakest of all the major indices.
On the chart below, there’s a series of lower highs, lower lows that have oscillated into a massive bearish wedge.
Yesterday (Wednesday) was a Fibonacci 34 days (-1), from the print lows set on March 24th. That day was also a Fibonacci 34 days (+1), from the closing low set on March 22nd. We’re still posting a Fibonacci Time correlation.
From the highs set on February 2nd, to the lows on March 24th and then to the highs set yesterday May 10th, is symmetrical; separated by a Fibonacci 8-weeks lower and then Fibonacci 8-weeks higher.
Fundamentally, this sector is a disaster. None of the top ten equities have a P/E. All are losing money.
No P/E and operating at a loss; interest rates rising, credit standards being tightened. How are these outfits going to secure more Venture Capital (or any additional funding via stock/debt) in that environment; implosion is dead-ahead (not advice, not a recommendation).
Bank failures continue … at some point (as with the rest of us) one of these banks may be the line of credit for company payroll. Not all banks went bust in The Great Depression but just enough to halt payroll for some key industries. That event helped topple the economy.
The list goes on but that’s enough to make the point.
Now, on to the charts.
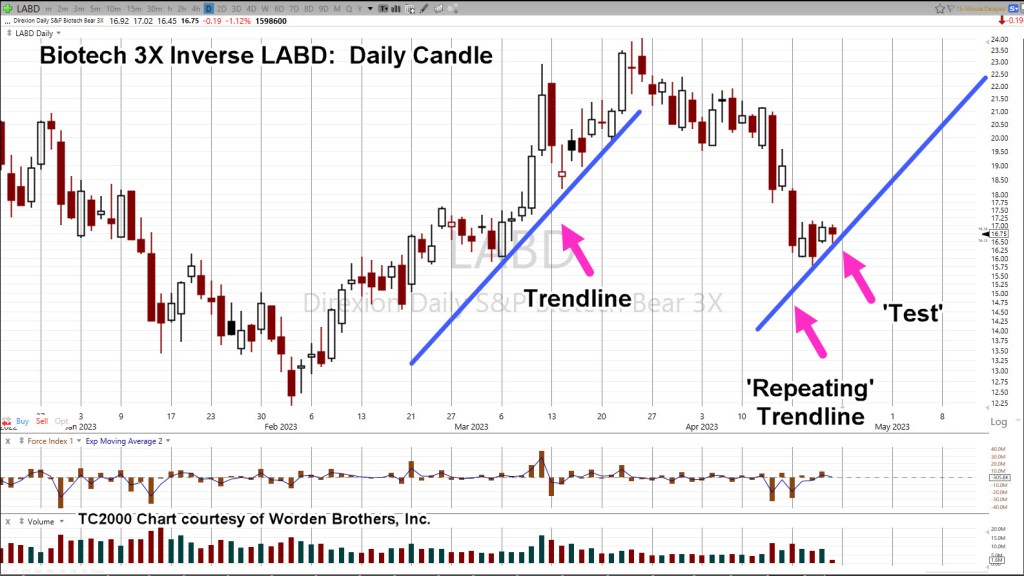
Biotech SPBIO, Daily Close

Moving closer in, to show the Fibonacci retrace, the Fibonacci time and the ‘a-b-c’ structure.
As of this post (12:25 p.m., EST) price action continues its downside reversal.
Because the retrace level (76.4%) is the highest noted by Fibonacci, we can expect some amount of upward testing if there’s going to be a sustained downside.
Anything can happen. However, with the above list compiled for both technical and fundamental conditions, probabilities point lower (not advice, not a recommendation).
Stay Tuned
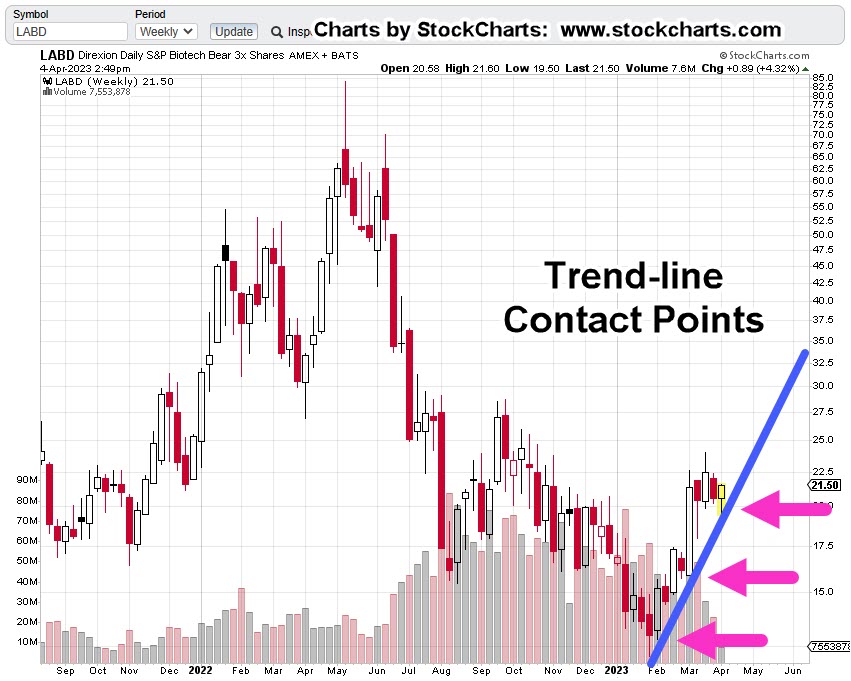
Charts by StockCharts
Note: Posts on this site are for education purposes only. They provide one firm’s insight on the markets. Not investment advice. See additional disclaimer here.
The Danger Point®, trade mark: No. 6,505,279