Like GLD, in this report, GDX looks like it’s correcting in a-b-c, type fashion.
The GDX chart shows the Fibonacci projection with target indicated (blue line and arrow).
If the dollar (UUP, proxy) reverses and heads towards resistance 24.75 – 24.80, while gold counter-trends higher, we’ll have a tenuous situation.
Something will break; gold or dollar and probably both. The dollar higher, gold along with the rest of the market, lower.
With so many short on dollar and bonds, if UUP gets to underside resistance, a reversal (to test back to 24.50 lows) could be very short lived.
Keep in mind, when it all comes apart at the seams, it’s likely to be quick.
In other markets, XOP in the pre-market shows a slightly higher open with DUG showing lower.
After the session is over and if there’s a new daily high in DUG, the stop will be moved up (not advice, not a recommendation).
Separately, and as public service, here’s a link to an old article written by Robert Prechter Jr., way back in 1986; what it takes to be successful in the markets.
It’s a good read … probably the most important part is the last bullet item, No. 5 “The Mental Fortitude To Accept Huge Gains”
Note: Posts on this site are for education purposes only. They provide one firm’s insight on the markets. Not investment advice. See additional disclaimer here.
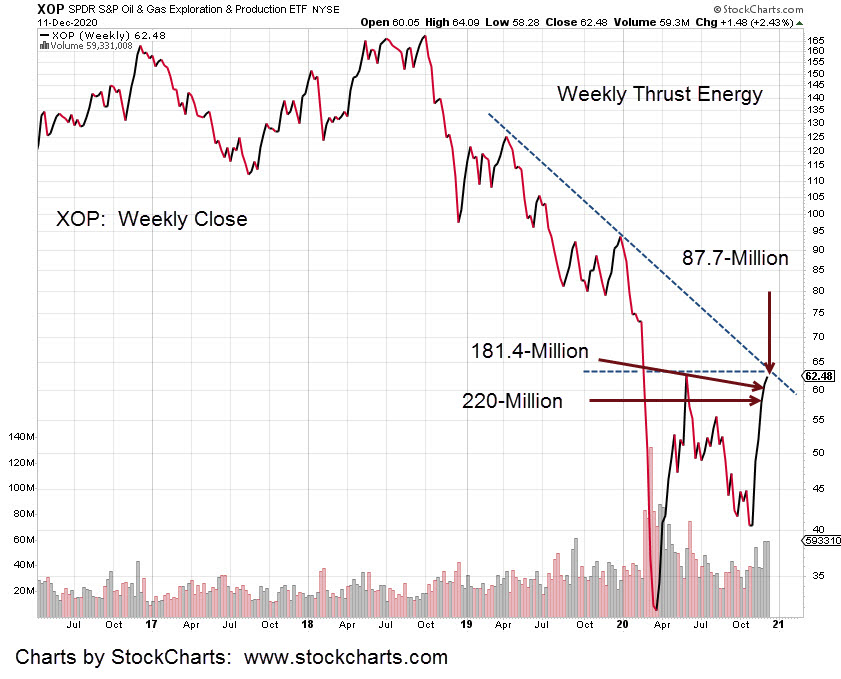
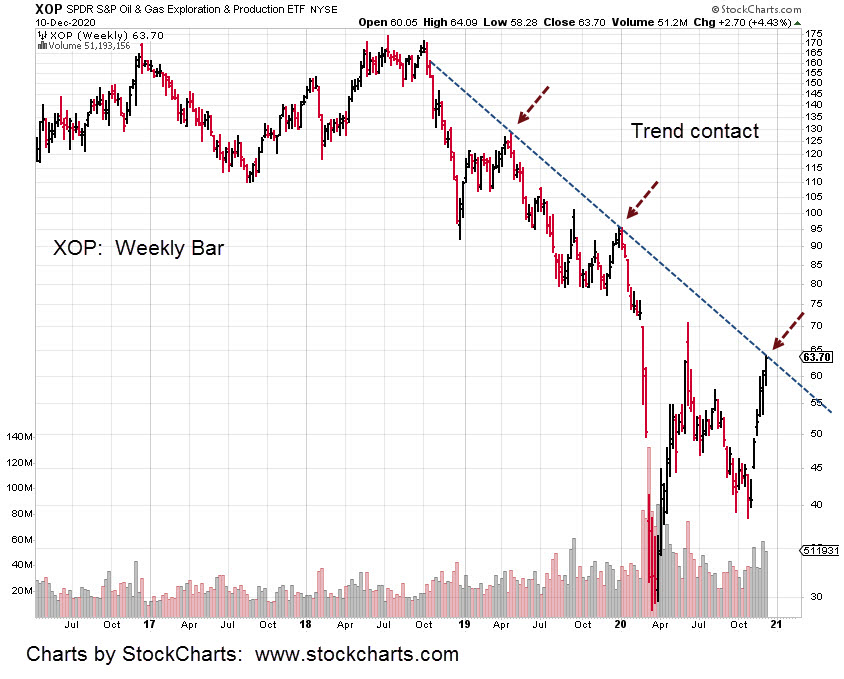
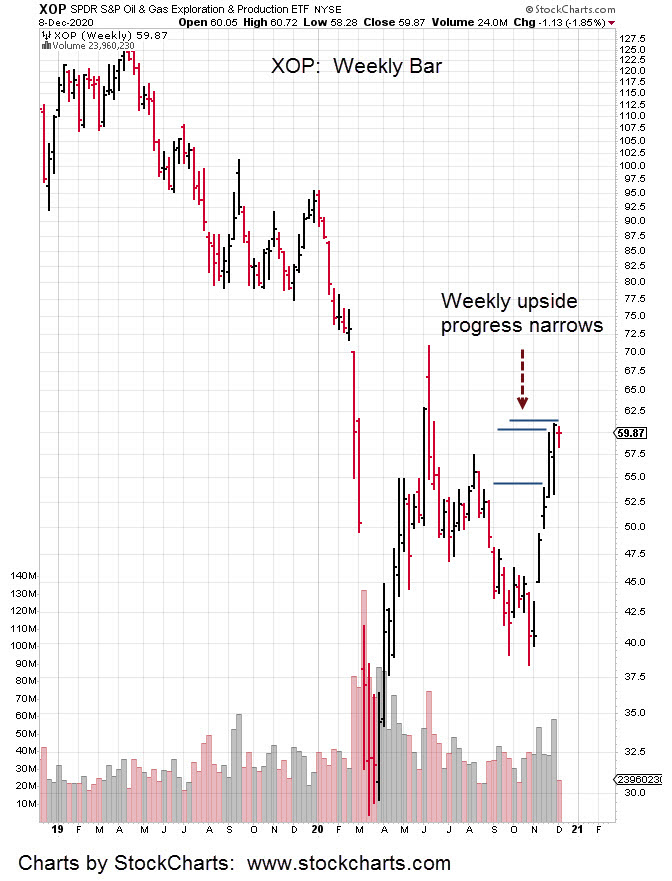
The first hour is over: XOP (Oil & Gas) posted a new daily low.
Correspondingly, inverse fund DUG has posted a new daily high.
This is now, potentially a very dangerous juncture in the markets.
The firm is fully positioned (not advice, not a recommendation) in DUG.
Wyckoff analysis directives concerning bear markets, were used to identify (at this point) the single position.
More specifically, those directives are to identify the weakest market(s) not the strongest.
It’s the weak markets that will go down farther and faster during mark-downs (or bear phases).
Through a process of iteration (lasting months) as detailed in these updates, the weakest market up to now, has been identified and short positions opened via DUG.
Based on today’s action thus far, we have a hard stop in DUG which is the session low: DUG @ 24.727.
It’s unlikely price action will return and penetrate that (24.72) low.
The firm uses trading tenets from three market masters as detailed here.
There are essentially two main tenets from the late Gerald M. Loeb (former Vice Chairman of E. F. Hutton) and those are:
First:
Significant market opportunities are rare. When one is identified, use it to its maximum extent.
Second:
Do not diversify. Diversification is for those who don’t understand market behavior. Diversification is for the average … the mediocre.
That last admonition is harsh indeed. However, it’s backed by evidence from the top traders. Over and over we see their positions (detailed in the press after the fact) were highly concentrated.
Of course, none of the above is a recommendation.
In the next instant there could be an event which completely turns around the oil sector’s fundamentals … like a major earthquake taking out millions of barrels of supply.
As we have seen with seismic activity increasing dramatically, that scenario is not too far fetched.
At this point, we’re positioned in DUG. Hard stop, DUG 24.73
Note: Posts on this site are for education purposes only. They provide one firm’s insight on the markets. Not investment advice. See additional disclaimer here.
When compared to two weeks ago, Force Index (thrust energy) to the upside in XOP, has declined over 60%.
The pre-market shows that XOP may open higher. If so, it will be into dissipating bullish demand combined with confluence of resistance discussed in the last report.
The first hour of trade may let us know if XOP has run its upward course.
As always, price action is the final arbiter.
The anticipation is for a reversal … soon. If not, then it’s time to wait (as is being done with Biotech, IBB) until price action confirms the change.
Note: Posts on this site are for education purposes only. They provide one firm’s insight on the markets. Not investment advice. See additional disclaimer here.
Fundamental data such as the latest EIA Report on crude inventories, were opposite of expectations.
Opposite in a big way.
Inventories are building up as demand has evaporated.
At the bottom of that EIA link, is perhaps the most important data point of all. Global operating rig count is at all time lows … data since 1975.
Inventories are building up even in the face of collapsing rig counts.
Prior to that report, was anecdotal evidence (of the same) from comments made on ‘macro’ updates from Steven Van Metre.
Anecdotal evidence (if accurate) points to the possibility for investigation. It does not, and can not (like macro itself) tell you “when”.
When is the move going to start? When is the top or the bottom? That’s where the technicals and reading the tape comes in.
What the tape is telling us now, is the ‘when’ may have been last week. Specifically, the last three days of last week.
That’s when massive volume flowed into the inverse (2X inverse Oil & Gas Sector) fund, DUG.
From a weekly standpoint, volume was the highest since the week of February 9th, 2015.
Approximately $55-million traded hands last week as opposed to $25-million the week prior and $19-million the week before that (estimating average prices).
It’s evidence of significance with possible high volatility ahead.
The broker being used by the firm lists this trading vehicle (DUG) as “not marginable”.
The inference is, DUG is so volatile (both up and down) the broker is not willing to allow any of its own funds to be at risk for the trade.
That assessment is backed up by price action itself. Just last month, on Monday, November 9th, DUG opened down -20% from the Friday before.
Even with the margin restriction, huge volume rolls in.
Moving on to the weekly chart of XOP (SPDR non-leveraged Oil & Gas fund), we’re at a confluence of trend-lines.
This is the low risk area or the danger point.
Price action can go either way; the tape points to potential for a pivot point down (with DUG up) at or near this area on the chart.
At time stamp 16:28, in this report from Van Metre, the Put/Call ratio has exceeded the dot-com bubble levels of 1999 – 2000.
The XOP move higher under these conditions has the look of a huge short-squeeze. Fundamentals are not there (in a big way) to support higher oil and gas prices.
There is no (and won’t be) recovery for years; even decades to come.
It took the Dow Industrials twenty five years (late 1954) to come back to 1929 levels.
It’s highly likely we’re in a bear market set-up that’s an order of magnitude greater than ’29.
Note: Posts on this site are for education purposes only. They provide one firm’s insight on the markets. Not investment advice. See additional disclaimer here.
While gold (GLD) remains in the channel presented here, the corrective move does not appear complete.
We’re using a daily (close) chart of GLD to show the current “a-b-c” correction unfolding.
The corrective wave labeling in lower case letters, takes its cue from Elliott Wave analysis.
The solid line marks an axis line already defined by price action.
That line (~177.50) just so happens to be a 38.2% retrace of the entire GLD move (from the August 6th high) as well as 61.8% of the distance covered by wave “a” (when measured from wave b).
The wave “c” of a corrective move tends to mimic a Fibonacci length of the initial wave “a”
Typical wave c lengths (of a) are 38.2%, 61.8% and 100%, or equal length.
Empirical observation has shown “c” wave distance of 50%, usually moves on higher to at least 61.8%.
From a timing standpoint; Fibonacci 13, days from the November 30th low, is December 16th; Fibonacci 21 days is December 29th.
Note: Posts on this site are for education purposes only. They provide one firm’s insight on the markets. Not investment advice. See additional disclaimer here.
One recent example; the bond move from late 2018, to early 2020.
During the low from October 2018 to November that year, were reports of professionals opening huge long positions.
At the time and as the weeks went by, it appeared that nothing was happening.
The delay would have caused the typical i-phone addicted ‘tweeter’ to lose interest many times over.
When it finally took off, bonds staged a huge directional move that lasted over a year.
Such moves are rare and require the ability to wait. Wait to get in and wait for the move; minimize transactions.
Each market transaction is an opportunity for error. Minimize the transactions and by definition, the errors are minimized as well.
That brings us to oil and more specifically, XOP and DUG.
The nonsense being promulgated by the financial press is that oil is moving higher on ‘hopes’ for an economic recovery.
Maybe injecting the world-wide population with potentially DNA altering technology (not even tested on animals first) for an ailment that does not exist will miraculously launch some kind of pent up consumer demand.
No matter. Oil and its attendants keep moving higher with the dollar moving lower.
Even with anecdotal evidence from an Oklahoma oil field worker (commenting on a Van Metre update) that was later confirmed by the EIA report did not cause oil to move lower … yet.
That is, until today.
The dollar attempted to continue its downtrend yesterday. Oil spiked as did XOP to the upside and DUG to the downside.
This morning is a different story. Dollar proxy, UUP is trading (pre-market) right at its highs of the last session in an apparent reversal.
Oil along with XOP is down, with DUG up.
Looking at XOP, we see it’s hitting a long-established trend line.
With the dollar, bond, and overall market extremes, no recovery in sight and more probable, another (and complete) collapse; this may be the spot (not advice, not a recommendation) to position for medium to long term on the short side.
That’s exactly what the firm has done. Looks like our position was a day too early as we sat through yesterday’ spike lower in DUG.
Volume remained heavy for that DUG session. Weekly volume is looking to be the largest (big-money moving in) since at least 2015.
Note: Posts on this site are for education purposes only. They provide one firm’s insight on the markets. Not investment advice. See additional disclaimer here.
For the hyperinflation crowd, yesterday’s weak action in gold must have been a surprise.
That action may signal a change in character. The GLD chart shows the long supposed bull flag that’s been going on now for nearly five-months.
If the dollar’s in free-fall destruction, then you would expect precious metals to be on a tear.
Not happening.
Going way back to a real bull market like the launch of the S&P in 1995; we can see strong bull markets are unexpected, violent, and do not allow anyone to get aboard comfortably.
That market lift-off lasted a full eighteen months before a meaningful pull-back.
Gold on the other hand appears punch-drunk.
The chart shows two trading channels. The one we know and the one that may be happening now.
In today’s action, gold could attempt to close the gap.
How price action behaves as it (or if it) moves upward will give clues to whether or not it’s now counter-trend to test (before reversing), or impulsive, gathering steam for a breakout higher.
The dollar is at trading range lows. Bonds appear to be completing their test of the Wyckoff spring set-up discussed here.
There are still massive short positions on both. Probabilities favor counter-trend action in gold with the real downward push yet to come.
Note: Posts on this site are for education purposes only. They provide one firm’s insight on the markets. Not investment advice. See additional disclaimer here.
Inverse Oil ETF, DUG volume went off the scale today; the highest in at least four years.
The short-squeeze top in the sector, using XOP as the proxy was identified before today’s open in this report.
At that time, there was nothing significant about either XOP, or the inverse DUG other than being at opposite price extremes.
Today’s action changed that view.
Apparently the juncture was significant enough; Today’s transaction volume in DUG, amounted to approximately $23-million.
That’s a huge number. Typical action is around $4-million.
Oil is inversely related to the dollar at this point. The dollar proxy, UUP reached a new trend low last week but seems to have found support the past three sessions.
Being short the oil and gas sector via DUG (not advice, not a recommendation) is essentially a leveraged bet on a dollar rally.
In other markets, after weeks of analysis and planning, biotech had its reversal but we’re not in it (on the short side) having exited yesterday.
Not to worry; the massive volume inflow to DUG suggests that we’re on the right track with who (or what) is going to be most vulnerable to a market reversal.
Biotech (IBB) price action may retrace upwards to test. If and when it does, we’ll re-evaluate.
Note: Posts on this site are for education purposes only. They provide one firm’s insight on the markets. Not investment advice. See additional disclaimer here.
It’s great that Texas has brought suit for ‘illegal’ voting.
However, with eyes wide open, there could be more going on than just contesting an international vote-rigging scheme that has entrenched corruption on a grand scale.
The oligarch controlled medial of course puts their spin on it and plies its evil trade.
Despite the way it looks, lawsuit and all, this could really be the first salvo on U.S. Balkanization. Plenty of information exists on the topic; here’s one source.
Texas of course would have to establish ground rules or structure for such action …. If that was to happen at the current pace of events … five years? Maybe faster.
A complete collapse and mass unemployment (with civil unrest … oh wait) would of course help things along from a public acceptance perspective.
Outlandish you say … complete insanity. Really?
How outlandish is an entire population running around with a piece of toilet paper across their face … afraid of something (the speck) that’s not even there. Even the CDC admits ‘no isolates [of the virus] are currently available [because it does not exist]’.
Go ahead … take a trip to your local graveyard. Where are the bodies?
By now, a real world-wide pandemic would have municipalities passing special measures (and taxes) to annex additional land to keep up with the dead. Back-hoe operators would be in short supply and a booming business.
Not happening; because it’s not there. The real story is here.
So, what about the markets?
Yesterday, the short positions in biotech were closed out as we got a higher open (not expected) instead of lower; even though bid/ask right up to the opening bell indicated a lower open..
IBB has now pushed past the 150-target area. There are no more forecasts for this sector. We’re at the target and no reversal … yet.
Moving on and giving credit where it’s due, Steven Van Metre, is the situation in oil.
With a huge economic slowdown (another collapse) coming, demand for oil is likely to vaporize yet again. Recall when the futures market went negative just eight months ago?
Oil prices may have been bid up on expected demand from a “re-opened” economy. That’s the current narrative.
What’s really going on looks like a short-squeeze that may have played itself out. The Weekly chart of XOP (oil/gas production ETF) shows upside progress has stopped dead.
Positions:
Based on the weekly price action of XOP shown below, we’re short oil and gas via DUG; a position established late yesterday.
At this juncture there’s no hard stop (not advice, not a recommendation) but we’ll wait during the fist hour of the coming session to see how the hourly bar posts.
Last week’s high in XOP was 61.06. If price action pushes beyond that by any appreciable amount, we’ll exit inverse DUG.
Note: Posts on this site are for education purposes only. They provide one firm’s insight on the markets. Not investment advice. See additional disclaimer here.