Drinking The ‘Gold’ Kool-Aid

Because You Can ‘Eat’ Gold, Right?

A military invasion of Ukraine, nuclear power plant (supposedly) bombed, set on fire, power outages and potential food rationing, yet gold’s still below all-time highs?

Not only that as we’ll see below, the actual price has traced out what’s so far, a counter-trend (a-b-c) move; that is, the main trend is down … not up.

I like gold as much as the next guy but we’re seeing again and again, that’s not the crux of the immediate (world-wide) plan on a go forward basis.

Dollar & Gold: Game Of ‘Chicken’

Like a game of chicken, both the dollar and gold rallying strongly together; waiting to see who’s going to reverse first.

What do you think?

With as much control as certain entities have over both the dollar and gold … who’s likely to turn lower first?

If it’s gold, then at this juncture (below), it’s in a good position for reversal.

Weekly Gold (GLD) Close

The yellow vertical lines above, are of equal length.

GLD could push slightly higher and still maintain the ‘corrective’ a-b-c, structure.

As labeled, price action fits the ‘rule of alternation‘. The structure of the ‘a’ wave is brief and sharp. The structure of the ‘c’ wave is overlapping and longer duration.
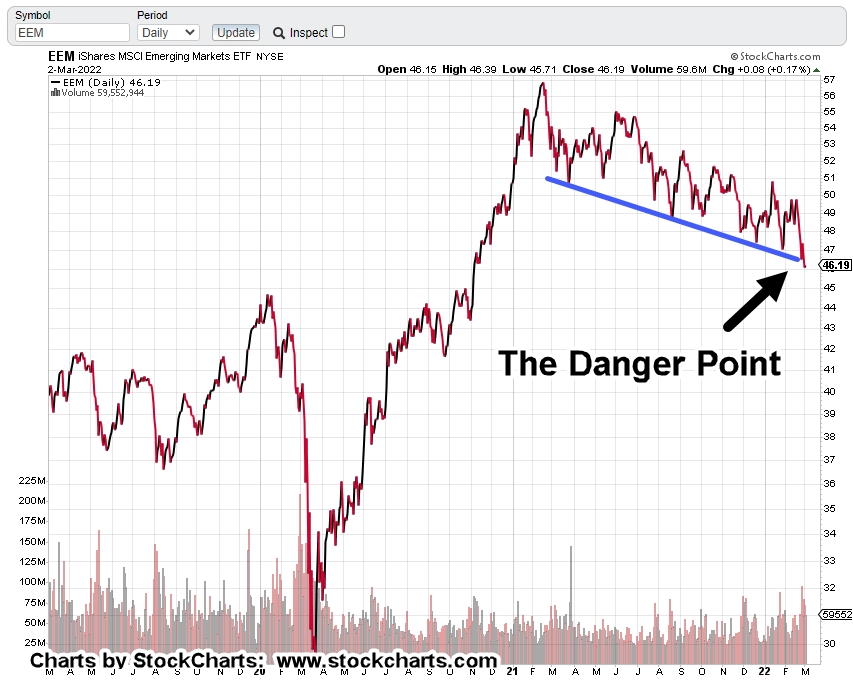
The Danger Point:

Gold (GLD) is there now.

Continued upward pressure would change the ‘reversal’ assessment, to potential breakout … much higher prices ahead.

However, as J.B., points out in this latest video (time stamp 9:25) saying, he’s never seen so much traffic on the roads … as if gasoline’s at 99-cents.

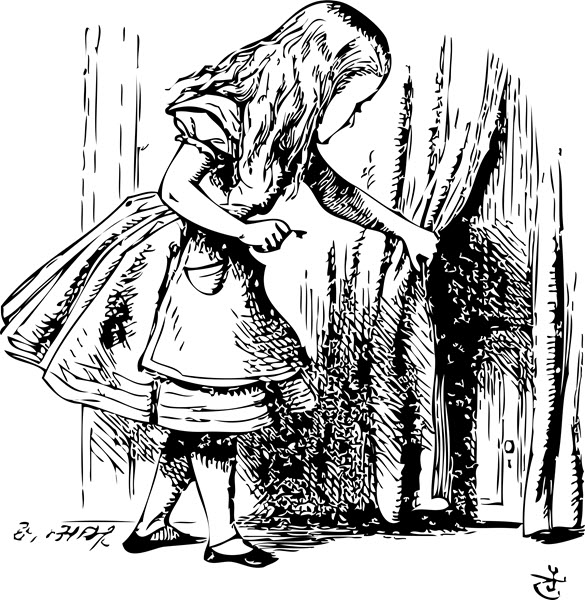
One answer could be, this is the herd:

Completely unprepared and running around to find another herd as equally unprepared.

Panic buying of precious metals because everybody else is doing it, could be the reason behind gold’s current juncture.

Stay Tuned

Charts by StockCharts

Note:  Posts on this site are for education purposes only.  They provide one firm’s insight on the markets.  Not investment advice.  See additional disclaimer here.

The Danger Point®, trade mark: No. 6,505,279

Taiwan Semi … On The Edge

Down On Heavy Volume

Taiwan Semi (TSM) is the heaviest weighting in both the Emerging Markets, EEM, and the SOXX.

Those indexes were down sharply on Friday with EEM, losing just over -2%, and the SOXX down -2.65%.

Even though the SOXX, was lower in percentage terms, it’s EEM, that may be entering free-fall territory; led by its largest component, TSM.

World (planned) Instability

At this point, that’s an understatement.

There’s no telling if somehow, Taiwan (the nation) is going to be dragged into the fray.

Note: As this post was being finalized, we have this, just out.

The good news (sort of) is from a Wyckoff analysis standpoint, we don’t have to know the inside scoop on who or what has plans to do next.

To be very blunt, those in the know are so arrogant and greedy, their actions are going to show up on the tape.

That same arrogance and greed was rampant in Wyckoff’s day … why should it be any different now?

Taiwan Semi (TSM) Weekly Chart

As we can see, TSM closed the week just below support on very heavy volume.

Downward thrust pressure is immense.

The coming week could see an attempt to ‘relief rally’ or we could just continue lower in earnest.

If TSM breaks lower, it’s in ‘free-fall’ territory as there’s no real support until the 80-area … down nearly – 24%, from current levels.

Leveraged Inverse Fund: EDZ

As covered earlier, the leveraged inverse fund EDZ, has picked up in volatility as well as trading volume.

The daily (close) chart showing the breakout is below:

The second chart documents trade entries and current stop location (not advice, not a recommendation).

The entries may look to be at ‘elevated’ levels but recall in the last report, the market tested its breakdown … tilting probability to the downside (upside for EDZ).

Entries were made at support/resistance trendline break and test … ‘the danger point’

The EDZ, fund typically, is not popular and is normally very quiet; however, that all changed in the past two weeks.

The EDZ, Entry

Let’s dig into the nuances of the entry on the two charts below. From the closing chart above, the entry looks like it’s hanging in mid-air.

Looking the ‘prints’, shows the entries made at (nearly) the lowest risk point(s) possible.

The day prior to the 10.86, may have been the best but recall from this update, the entry was made as price action tested the breakdown of support/trend on the EEM.

The trade plan for the next day (March 3rd) was if EDZ made a new daily high, the breakout is likely underway.

Another entry was opened (mid-session) as price action pulled back from that new daily high (new low for EEM).

Note the stop was originally set at the March 2nd, low of 10.69, then moved up to 10.90, the next day.

If stopped out at this juncture, the entire trade would be at break-even (not advice, not a recommendation).

Note in the charts above, there were several false attempts to break to the upside. Each attempt was followed one or more red bars (candle) that negated the attempt.

The current breakout looks like the real thing but it too, was initially followed by a red candle (February 25th).

In this instance, price action reversed and started making higher-highs and higher-lows.

That was the signal to go long.

Summary:

At this juncture, trade EDZ-22-01, is fully positioned (not advice, not a recommendation).

Anything can happen between now and the open on Monday. However, the power of TSM’s thrust lower suggests downside continuation is a high probability.

Let’s not forget, we’re in a market environment where a ‘fat-finger‘ upset is not just a possibility but highly likely.

Stay Tuned

Charts by StockCharts

Note:  Posts on this site are for education purposes only.  They provide one firm’s insight on the markets.  Not investment advice.  See additional disclaimer here.

The Danger Point®, trade mark: No. 6,505,279

Nuke Plant On Fire … And Gold ?

There’s a nuke plant on fire (so we’re told) and gold hardly moves.

It’s up a paltry +0.40% (as of 8:45 p.m., EST) and still below the highs set on February 24th, according to futures contracts linked here.

There are no charts with this post.

Only the assessment there’s something very wrong with the whole ‘war story’.

Perhaps the latest report from ice-age-farmer can shed some light on what’s really happening; the ‘big picture’.

Going to that report brings us right back to Genesis 41: It’s the corn and the grain first … then gold and silver.

Stay Tuned

Charts by StockCharts

Note:  Posts on this site are for education purposes only.  They provide one firm’s insight on the markets.  Not investment advice.  See additional disclaimer here.

The Danger Point®, trade mark: No. 6,505,279

Emerging Markets, Breaking Down

Trend-Line, Confirmed

A new daily low for EEM, Emerging Markets, confirms the trend-line, outlined below.

Looking at the components of EEM, has it essentially a Taiwan Semi (TSM), and Tencent Holdings trade.

Taiwan Semi, topped-out mid-January, this year and has declined nearly – 25%, since its high.

Looking at the weekly chart of TSM (not shown), has it currently hovering right at support levels … possibly giving price action a positive bias.

Even though today’s action confirms the trend, we’re still at the danger point; just a little bit of a shove either way, can cause EEM to bounce higher or collapse.

EEM Daily Chart

At least six trend hits above, provide confirmation.

We’re about midway through today’s session and price could still make a recovery.

However, momentum indicators (MACD) on three time-frames are all pointing down: Monthly, Weekly and Daily, thus tilting probability for lower action.

The chart below zooms-in on the trend-line hits.

The low(s) of the wide bar from February 24th, are likely to provide some amount of support.

If price action continues its decline, expect some amount of hesitation or indecision in this area.

Summary:

It’s about two hours before the close and anything can happen.

Trendline contact(s) and momentum indicators all show probabilities favor the downside.

Similar to yesterday, U.S. markets are mixed-to-higher (but with those gains eroding) while Emerging Markets, EEM continues to show weakness.

Stay Tuned

Charts by StockCharts

Note:  Posts on this site are for education purposes only.  They provide one firm’s insight on the markets.  Not investment advice.  See additional disclaimer here.

The Danger Point®, trade mark: No. 6,505,279

Meanwhile … Emerging Markets

As The U.S., Grinds Higher

There were sharp gains during today’s session but behind the curtain, Emerging Markets (EEM), may be at the danger point.

Overall gains went from +1.68%, for the Q’s to a stiff +3.18%, for the SOXX.

That buoyancy allowed one to see EEM, was not performing in kind. Its daily gain was only +0.17% … way out of line from the rest.

That’s not the whole story.

The longer term daily close of EEM, shows the air’s been going out of this sector for a while.

Note the blue down-trend/support line and arrow; we’re at the danger point.

The second chart gets closer in on that area.

It’s clear, the market respects this trendline; no fewer than four direct hits and potential fifth (January 27th).

EEM: Going Forward

There may be more testing action at the underside or today’s test could be complete.

Wild percentage swings as seen today, are not the sign of a healthy market.

Even so, with all that upward action, EEM is weak and may be showing its hand.

Leveraged Inverse, EDZ:

Leveraged inverse fund EDZ, daily volume has picked up markedly over the past eight trading sessions.

Increased volume indicates potential opportunity; speculators are moving in and providing liquidity (not advice, not a recommendation).

Summary:

At tomorrow’s session, a new daily low for EEM (high for EDZ) may be the signal, we’re headed lower … possibly verifying an EEM, downtrend line.

Stay Tuned

Charts by StockCharts

Note:  Posts on this site are for education purposes only.  They provide one firm’s insight on the markets.  Not investment advice.  See additional disclaimer here.

The Danger Point®, trade mark: No. 6,505,279

The Gold (GDXJ) Charts

Planning The Next Reversal

Will gold press on to new highs?

We’re at a juncture with gold and the market itself, determines the next trading move.

From the chart of the Junior Miners, GDXJ, below, it shows a now obvious upside reversal from a spring condition.

That is, when price action penetrated weekly lows at the end of January, it set up possibilities for reversal.

Junior Miners, GDXJ, Weekly

In what should be a very familiar looking set-up, we can see GDXJ, is heading for a potential up-thrust condition (magenta oval).

As a reminder, this is what the daily gold (GLD) chart looked like back in September last year, before a similar (downside) reversal:

The resistance line is there, the wide (high volume) bar, everything.

Gold To New Highs ?

For the GDXJ set-up to come about, it would make sense that gold would head higher.

As stated, we’re already at the 1:1, measured-move, a-b-c, level.

It’s important to note, that level (GLD, 182.60) has not been breached. Today’s action could have been a test of the highs in anticipation of downside reversal.

However, there’s a Fibonacci projection slightly higher to the GLD 196, area … just above the all time high of 194.45, set way back in mid-August of 2020.

Summary:

At this juncture, all short positions have been closed (not advice, not a recommendation).

It’s obvious world (and market) events are moving rapidly; the above analysis could be negated at the very next session.

Even so, it still provides a framework of what to expect should gold continue on to new highs … including the next target location, GLD 196.

Stay Tuned

Charts by StockCharts

Note:  Posts on this site are for education purposes only.  They provide one firm’s insight on the markets.  Not investment advice.  See additional disclaimer here.

The Danger Point®, trade mark: No. 6,505,279