Retrace to Reversal?

This past Wednesday, Senior Gold Miners GDX, retraced to 50%.
Thursday, price action tested that level and closed lower.
On the chart below, we’re going to present price action facts; leaving out ‘hyperinflation’, YouTube grifting, ‘dollar destruction’, ‘it’s all ending tomorrow’, click-bait.
Before getting to the chart, let’s add, on this site, it’s always been about the food supply first, then gold and silver, link here (not advice, not a recommendation).
The video at left, is five years old.
Since then, there’s been a massive learning curve concerning livestock.
All but one of those hens is gone now, she being retired, having produced 850 – 900 eggs.
Others have been brought in to continue the supply.
Now, on to the click-bait 🙂
Senior Miners GDX, Daily
GDX, posted an up-thrust, March 2nd, then collapsed a whopping -32.8%; read that, as ‘coincidental’ 33%.
It’s now retraced to 50%, and also in a potential channel.
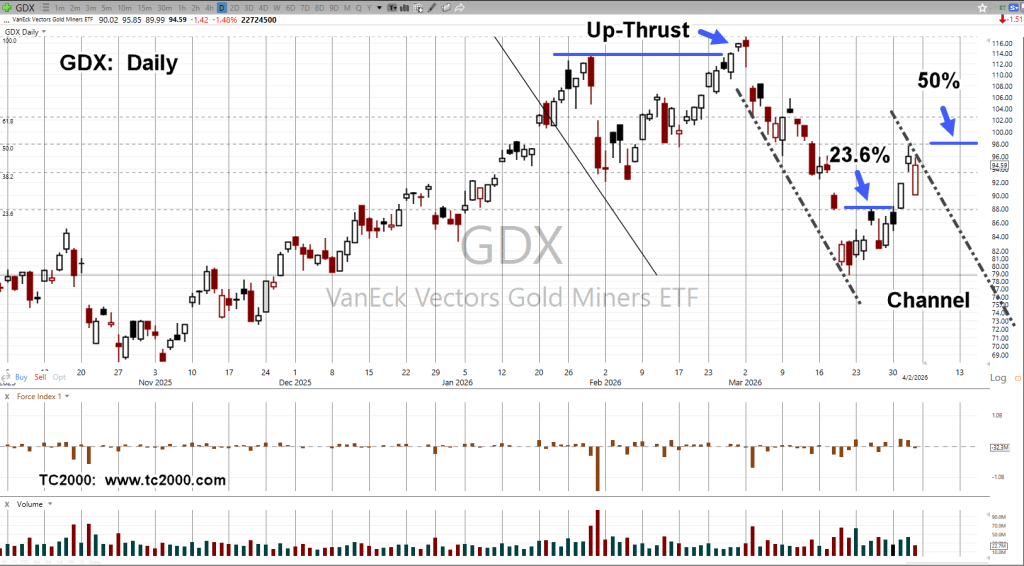
Volume for yesterday contracted on the test, but it was also a pre-holiday trading day.
So, let’s just note that and not put undue weight on the fact, commitment to the upside was weak (not advice, not a recommendation).
Stay Tuned
Charts by StockCharts
Note: Posts on this site are for education purposes only. They provide one firm’s insight on the markets. Not investment advice. See additional disclaimer here.
The Danger Point®, trade mark: No. 6,505,279