Lying In Wait … For Opportunity

As the ‘About‘ section says, this site provides one leader’s view on the market; what can best be termed as ‘Strategic Leadership’.
So, just what is that, exactly.
A good example is the current biotech analysis and action.
Biotech strategy, thus far.
No. 1:
Recognize biotech (SPBIO), as bear market leader.
No. 2:
Wait for opportunity to position short via LABD, on an upside reversal; A Wyckoff, up-thrust.
No. 3:
Monitor and increase the short position as the market allows. Continue until targets are met or stopped out (not advice, not a recommendation).
As can be seen, here, here, here, and here, the trade LABD-22-03, is progressing well.
It should be noted, this trade could be over in minutes, or go on for months. The price action itself, will decide when it’s complete (not advice, not a recommendation).
Now, on to gold in general and Seabridge, specifically.
The Gold Reversal
We’ve had several updates that show gold (GLD) has changed hands; from strong to weak.
Quite obviously, this assessment is completely opposite the narrative and the crowd consensus.
However, price action itself, has told us there’s been a reversal.
Recent posts here, here, here, here and here, successively build on themselves showing at this juncture, the gold direction, is down.
Leading Edge Chaos
Evidence continues to build, we’re just on the leading edge of chaos; likely to last for years, if not decades.
Go to time stamp 1:12 at this link and observe one of many efforts already in place to take down the current system.
Chaos, Opportunity, and Seabridge
All of the above brings us to Seabridge Gold (SA).
Going way back, 20-months, to the first post on SA, and taking the following from that report:
“If and when the markets (S&P, Dow, NASDAQ) reverse in earnest, there’s likely to be widespread panic. Just like last time [2007 – 2008] and probably worse.
As a side note: If and when we get there (panic selling), and if SA pushes below well-established support (6-area), the initial plan is to open a major long position … but with a significant caveat.
That caveat is: We’ll take possession of the actual physical shares (not advice, not a recommendation). The broker could put up a fuss and charge a fee. So be it.”
Now, that’s a strategy.
Back then, nearly two years ago, it was not so obvious why having the physical shares was important. I think the reasons for doing so now, are clear.
Let’s move on to the actual chart of SA and look at probabilities.
Seabridge Gold (SA), Quarterly Chart
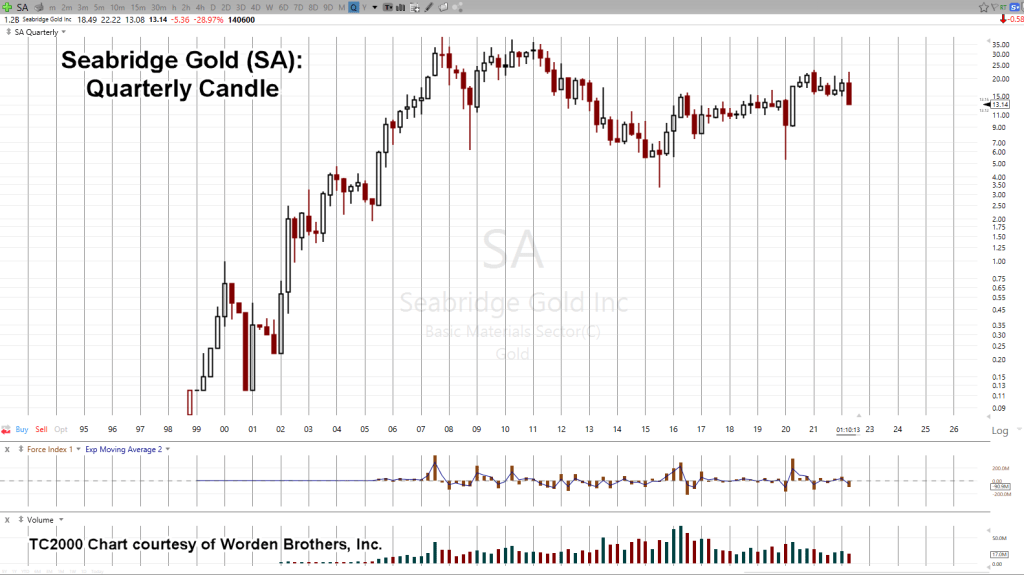
One thing is obvious just looking at the un-marked chart:
The bull market for SA, ended years ago; October of 2007, to be exact.
The actual price of gold (GLD) went on higher for over three-more years. Yet, SA languished.
Now, gold (GLD) has potentially reversed and there’s possibility for significant downside.
How significant? Well, somewhere in the range of $1,300/oz, or even lower.
Which brings us to the same chart of SA but adding Fibonacci projections.
SA, Quarterly Chart, Fibonacci Projection(s)

Getting closer-in with the zoom, we see the market itself has already validated those projections; especially the 38.2, level.

The 50% projection is near 5.00, and the 61.8%, is all the way down to 0.49 – 0.51.
Seabridge down to 50-cents, is that possible?
The Great Depression, 2.0
Those attempting to equate current events with the Great Depression, are at least doing the good work of recognizing the similarities and possibilities.
In the case of Neil McCoy-Ward, (linked above), he recognizes this time, is a whole other animal.
So, the answer is yes … SA could go to 50-cents. If and when it does, nobody will want to buy.
Stay Tuned
Charts by StockCharts
Note: Posts on this site are for education purposes only. They provide one firm’s insight on the markets. Not investment advice. See additional disclaimer here.
The Danger Point®, trade mark: No. 6,505,279
