Downside For Both?

The ‘bubble’ is obvious, Artificial Intelligence.
The ‘beast’, not so much, but revealed below.
The last update, presented a case for the SOXX top, a proxy for A.I.
Note: If the SOXX, has made its final high, it’s still very early in the reversal:
Wyckoff said a century ago, ‘It’s as if the weight of a feather can move the market in either direction’.
That’s where we are now.
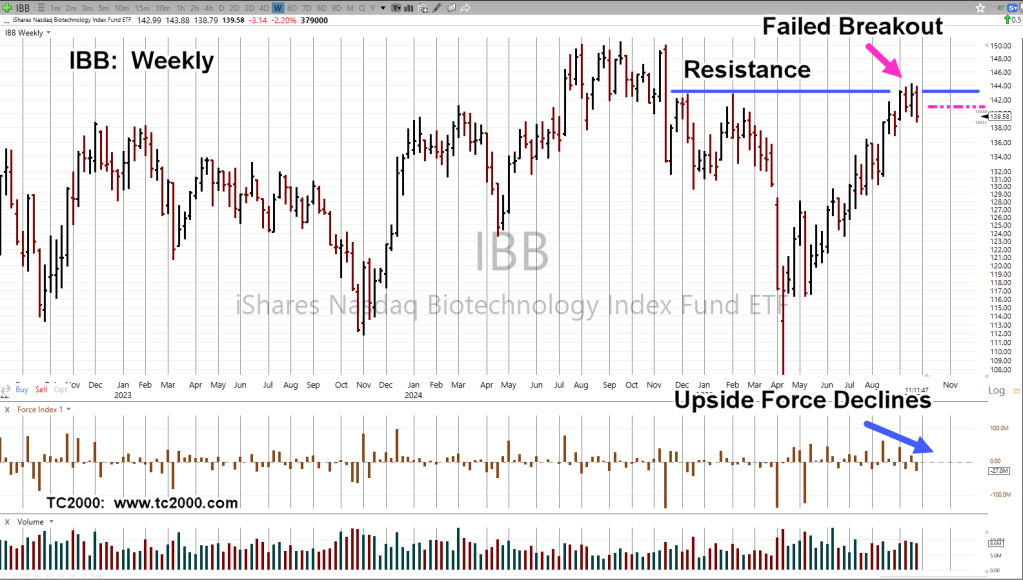
For biotech (IBB, XBI), different forces are at work.
Biotech IBB, Weekly
The 38.2%, retrace from 9/19 high, to 9/25 low, is in the vicinity of 140.90 (magenta dashed line).
Fridays are typically biased to the upside.
There’s a possibility IBB, may test (upward) throughout the session, heading to (at or near) 38%, by the end of the day (not advice, not a recommendation).
Stay Tuned
Charts by StockCharts
Note: Posts on this site are for education purposes only. They provide one firm’s insight on the markets. Not investment advice. See additional disclaimer here.
The Danger Point®, trade mark: No. 6,505,279

Wow, really good stuff. We closed at 140.96. Not an accident or coincidence. MACD is pretty elevated too making it a good short sale candidate. But I do worry about the bullish cross-over of moving averages.
LikeLiked by 1 person
Thanks again,
You are right, the moving averages (both daily and weekly) are, or have crossed to indicate an uptrend.
Strickly speaking the Wyckoff method uses no indicators. It’s scary stuff at the start.
There’s a book called ‘Entries & Exits’ by Dr. Elder, published in 2006. I have the book and if I remember right, David Weis was the only one that did not use indicators of any kind … only bar-charts and volume.
Back then I was still employed as an engineer and thought to myself, ‘How can that be?’ Everybody uses indicators.
Then came his video which might still be available (www.weisonwyckoff.com).
I have watched it probably hundreds of times, memorized it.
It’s a real eye-opener to what’s really going on the in the markets. His analysis of Apache Oil (APA) was mind-blowing.
Getting back to now, anything can happen with IBB. The averages say it’s in an uptrend. Momentum (MACD) says that energy is dissipating.
Toward the end of the session, I went short at around 140.82 (not advice)
Mondays are typically biased to the downside, and the expectation is for IBB to begin heading lower.
We’re right at the edge and if it starts to pressure higher, I have no problem getting out and then back to the sidelines.
Once again, I appreciate the input and look forward to any other comments or questions.
Regards,
Paul
LikeLike
I heard somewhere in a traderlion podcast that all technical indicators are just derivatives of price and volume anyway. So it’s not really that controversial to ignore a lot of them. Maybe I’ll look into that Dr. Elder book. Sounds like cool stuff.
LikeLiked by 1 person