It’s hard to describe how stretched the market really is; how ‘the euphoria is so maximized’, as quoted by David Quintieri of the Money GPS.
His latest report, delves into published articles that contain one market stretched quote after another.
Perhaps, the most frightening is:”This does not feel like the top”.
You can find that report at this link. The quotes listed above and more, start around the 1:40, time stamp.
In the markets as of this post (2:08 p.m. EST), biotech (IBB) continues to erode throughout the session.
The firm has made one LABD (3X, Inverse) and two BIS (2X, Inverse) entries this session so far. Not advice, not a recommendation.
Note the stop progression on BIS entries.
Positions are below; not advice, not a recommendation:
Note: Posts on this site are for education purposes only. They provide one firm’s insight on the markets. Not investment advice. See additional disclaimer here.
It’s been a while since biotech (IBB) was on the radar.
We’re going to look at the thirty-minute chart of 2X Inverse fund BIS, to show the change in character.
The first two oval areas after each up move in BIS (IBB down), was fully retraced. Not only that, the retrace occurred on the same day.
Not so with the last oval, today.
BIS has a changed character. The thirty-minute bar was not retraced; telling us we’re at the danger point where the risk is least.
Both the weekly and daily MACD indicators show momentum has shifted; stalled (on weekly) and has turned lower on the daily.
As far as shorting the biotech sector, any takers? It’s not like the other crowded trades; Dow, NASDAQ, S&P, and on.
As this post is being written BIS is edging back slightly to the entry point @ BIS, 22.23.
In so doing, there may be an hourly trend line forming. If that happens, updates will be forthcoming.
Note: Posts on this site are for education purposes only. They provide one firm’s insight on the markets. Not investment advice. See additional disclaimer here.
Note: Posts on this site are for education purposes only. They provide one firm’s insight on the markets. Not investment advice. See additional disclaimer here.
Inverse Oil ETF, DUG volume went off the scale today; the highest in at least four years.
The short-squeeze top in the sector, using XOP as the proxy was identified before today’s open in this report.
At that time, there was nothing significant about either XOP, or the inverse DUG other than being at opposite price extremes.
Today’s action changed that view.
Apparently the juncture was significant enough; Today’s transaction volume in DUG, amounted to approximately $23-million.
That’s a huge number. Typical action is around $4-million.
Oil is inversely related to the dollar at this point. The dollar proxy, UUP reached a new trend low last week but seems to have found support the past three sessions.
Being short the oil and gas sector via DUG (not advice, not a recommendation) is essentially a leveraged bet on a dollar rally.
In other markets, after weeks of analysis and planning, biotech had its reversal but we’re not in it (on the short side) having exited yesterday.
Not to worry; the massive volume inflow to DUG suggests that we’re on the right track with who (or what) is going to be most vulnerable to a market reversal.
Biotech (IBB) price action may retrace upwards to test. If and when it does, we’ll re-evaluate.
Note: Posts on this site are for education purposes only. They provide one firm’s insight on the markets. Not investment advice. See additional disclaimer here.
Bid/Ask spreads on Biotech (IBB) indicate a lower open.
From last night’s update, this was the expectation if we’re in the early stages of reversal.
Empirical observation over many months shows IBB, tends to move counter-trend for the first 90-minutes of trade … then resumes its original direction.
If that holds true for today (and we’re in a reversal), expect IBB to open lower and then attempt a move higher during the first hour and a half; right up to about 10:30 a.m. to 11:00 a.m. EST.
Note: That’s empirical observation; typical market action for IBB.
However, each day is different and price action itself has the final say.
Both accounts being managed already have significant positions (BIS & LABD) with a BIS stop @ 24.64 and LABD stop @ 27.63 in the market (not advice, not a recommendation).
Following Livermore’s approach (get in big … and do it early) the plan is to monitor price action for another opportunity.
If somehow there’s a higher open for IBB, then we’ll wait for a lower daily low (to increase position) or be stopped out … whichever comes first.
It’s still quiet in the markets. No one expects a major reversal. Retail is all in (although insiders are selling en masse).
There are fundamental reasons why biotech may be about to crack (big time) but those reasons are for another report. Here’s a preview.
Note: Posts on this site are for education purposes only. They provide one firm’s insight on the markets. Not investment advice. See additional disclaimer here.
It did not take long to be proven wrong. DUST positions (in both accounts) have been exited.
Stated before, a 23.6% retrace is a rare event. Looks like that’s holding true as price action for GDX now points to the 38.2% area.
That corresponds to GDX trading to around ~ 38 … a long way to go higher.
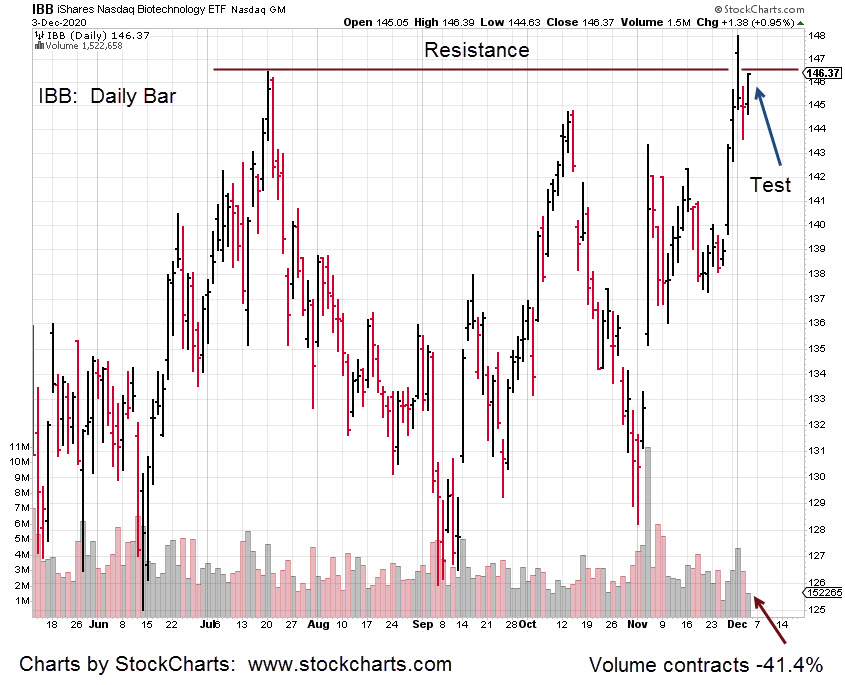
Biotech, shown below is just 0.69-pts shy of target with price action (as of 10:34 a.m. EST) coming back to test the early session lows.
It’s traders discretion (not advice, not a recommendation) to determine if today is the day IBB finally reverses and confirms the bearish weekly MACD divergence.
At this point, daily action has quickly retraced from the high of 149.31
Note: Posts on this site are for education purposes only. They provide one firm’s insight on the markets. Not investment advice. See additional disclaimer here.
In the pre-market (8:52 a.m. EST) action continues to grind higher. Both the Dow and S&P have posted new highs thus negating the Holiday Turns scenario … but not by much.
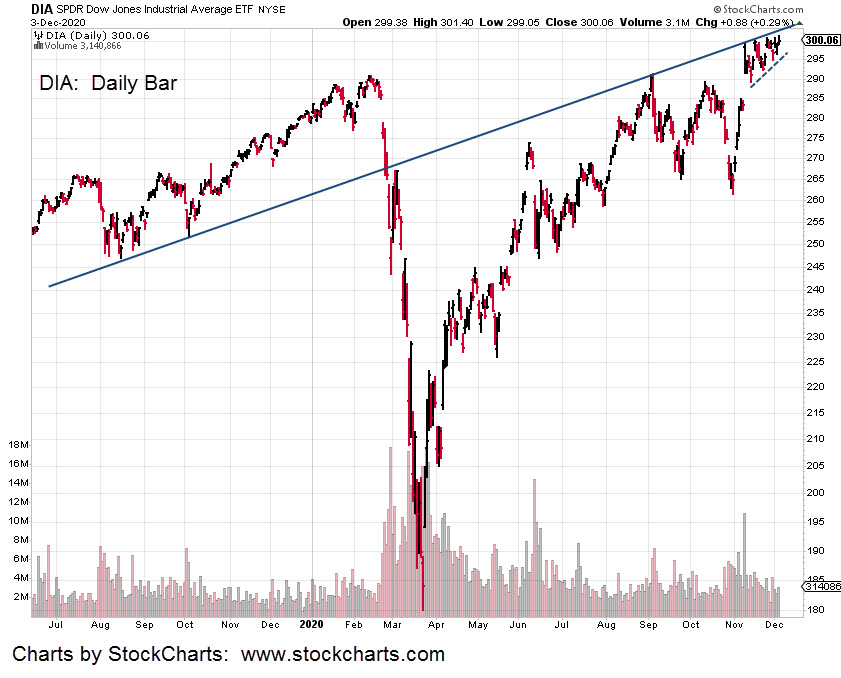
Important to note is each market continues to post on the underside of a long-term trend-line. The Dow chart (DIA) is farther down this post.
Also added to the chart is the dashed trend-line underneath the recent price action. A wedge is being formed; typically last stop before reversal.
In other markets, looks like Biotech may continue higher but along with the others, action appears labored.
The short position could be stopped out at the open.
This area of price action is where cost of being wrong is least. We’re at The Danger Point.
Update: 9:04 a.m. EST: Both AMGN and MRNA have now posted lower in pre-market.
Stopped out does not mean there’s no opportunity. The bearish MACD divergence is still there.
If IBB continues higher, the original ‘150’ target is back in play.
The market extremes are still there: Bonds and the Dollar are short the most in history. Stretched all around.
It’s not unreasonable to expect several attempts to position short.
Note: Posts on this site are for education purposes only. They provide one firm’s insight on the markets. Not investment advice. See additional disclaimer here.
Note: Posts on this site are for education purposes only. They provide one firm’s insight on the markets. Not investment advice. See additional disclaimer here.
Instead of reversal in the overnight, gold went higher.
Keeping with the potential down-trend theme, we’ll pull out to the next larger time-frame; the weekly.
The 23.6% retrace level, is approximately 172.60 – 172. 70, when measured on the weekly chart. Pre-market action in GLD (as of 8:55 a.m. EST) is at 172.40 – 172.60 range.
So, we’re there.
This is a good example of price action coming back to test wide, high-volume areas such as posted last week. It’s what markets do.
From a trading standpoint, the DUST position could be stopped out if price action remains at this level to the open.
Not a problem. Every trading action results in creating another data point for a future entry.
Moving on to Biotech (IBB):
Using LABD (3X Inverse IBB) as the high-volume proxy, it’s oscillating in a narrow range and essentially unchanged.
Separately, David Quintieri at the Money GPS, comments here, that he’s being chided for not giving financial advice and not indicating which stocks to buy.
In addition, Steven Van Metre, in this report states the Dollar and 30-Year Bonds are shorted to unbelievable, historic extremes.
He also states that ‘when the market finally reverses, it’s going to be violent.’
The wipe-out, when it comes will likely be on several fronts.
Note: Posts on this site are for education purposes only. They provide one firm’s insight on the markets. Not investment advice. See additional disclaimer here.
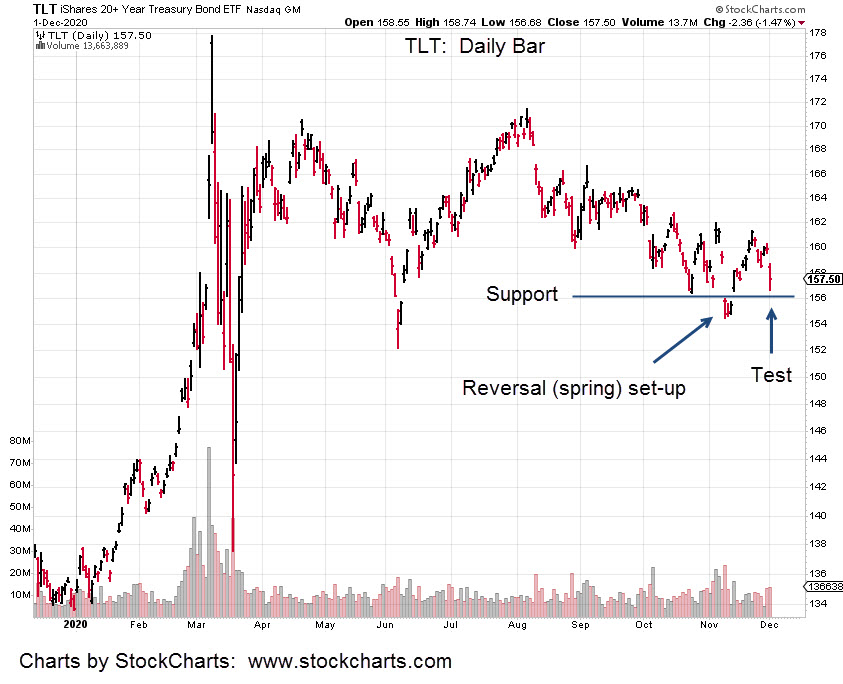
Bonds (TLT) were hit hard during the last session. Are higher rates ahead?
The short answer is no … if the test shown in the TLT chart holds.
What we have is typical market action at a significant reversal.
Putting it in perspective, the push below support (blue line) lasted a full three days before reversing higher.
Then we have twelve days of upward recovery until yesterday. Price action was slammed -1.57%.
It might look like we’re headed back to lower bond prices and higher rates; in effect, what we really have is a test of the reversal.
You can almost feel it. A major event is near.
The equity markets at all time highs … extremes of ‘retail’ participation never seen before.
Couple that with the largest-ever short position in the bond market (about to get squeezed).
The dollar’s at the bottom of its trading range … gold already heading lower.
The sense is a major market reversal is very near. It’s probably already happening but just not obvious enough … yet.
We’re not going long the bond market but rather going short other markets.
Most of the short position in DUST was exited during the last session when price action came back to the intra day highs. The potential squeeze got a reprieve at least for the day.
It’s important to note, yesterday’s GDX move went to a near exact Fibonacci retrace of 23.6%. The down-trend could proceed at any time.
Separately, a short was entered in the biotech sector via BIS (not advice, not a recommendation).
Pre-market activity (as of 9:02 a.m. EST) for IBB indicates a lower open with BIS correspondingly higher.
Note: Posts on this site are for education purposes only. They provide one firm’s insight on the markets. Not investment advice. See additional disclaimer here.







 The Danger Point®