Note: Posts on this site are for education purposes only. They provide one firm’s insight on the markets. Not investment advice. See additional disclaimer here.
Note: Posts on this site are for education purposes only. They provide one firm’s insight on the markets. Not investment advice. See additional disclaimer here.
Note: Posts on this site are for education purposes only. They provide one firm’s insight on the markets. Not investment advice. See additional disclaimer here.
So, the biotech short via LABD got stopped out last session.
Even though price action by its own behavior early in that session said to exit (at the highs), the position was maintained for the sake of argument.
The original stop was set at LABD 18.35, which was the 4-Hour low, noted yesterday.
Late in the session that stop was hit.
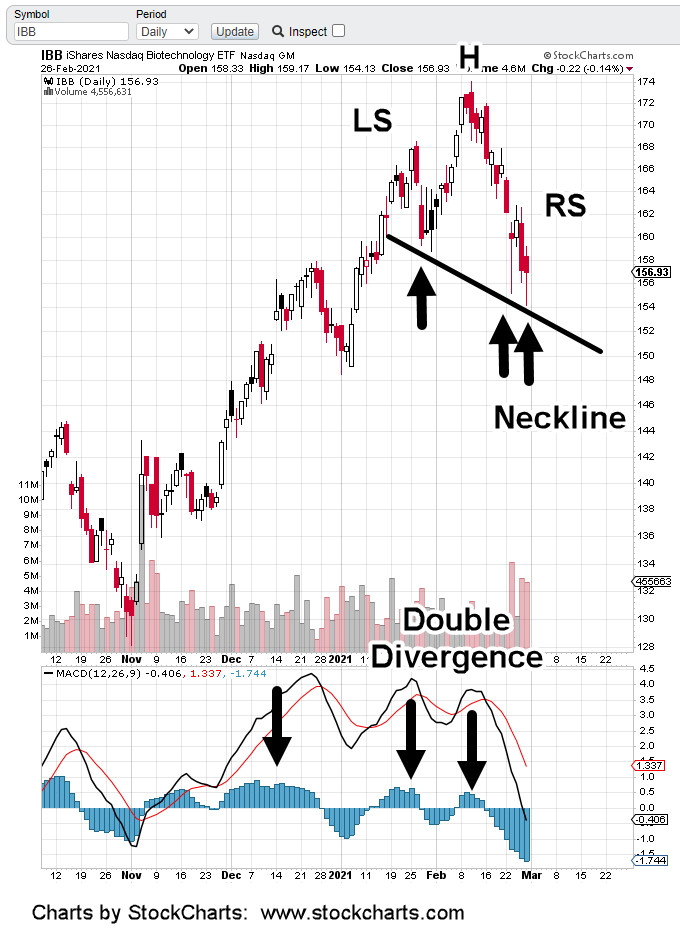
The overall sector (IBB) remains in a reversal with both daily and weekly MACD momentum indicators pointing lower.
In fact, Weekly MACD has a double bearish divergence in the histogram with MACD lines about to cross to the downside.
Putting all that together, expectation for inverse fund LABD is to head higher after yesterday’s counter-trend move.
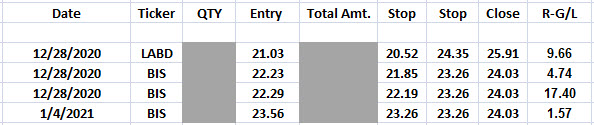
Once stopped out (at LABD 18.33), LABD was re-established at a lower price (not advice, not a recommendation).
That entry price is on the weekly chart below:
We’ve switched to a weekly chart to show there are two other times in the past year, where LABD had three weekly up bars in a row.
Those reversals had narrow ranges and thus were quickly negated. This time it looks different.
The current bar is not complete but with the overall market (S& 500) at extremes and ratcheting lower, probabilities are high LABD will close higher for the week.
As for setting the stop on the new position, we’ll let the market decide.
Counter-trend action in the early session is usually over by 11:00 a.m. EST.
We’ll look at LABD at that time. Till then, hard (emergency) stop is located at the weekly LABD low of 15.96
Note: Posts on this site are for education purposes only. They provide one firm’s insight on the markets. Not investment advice. See additional disclaimer here.
Here’s one method to use for a trailing stop; Have the market itself tell you were it goes.
The reason brokerage trading platforms have so many options with an endless list of indicators, is that’s what the (retail) public wants.
It has nothing to do (as usual) with what works best.
Wyckoff himself said the market defines the course of action. The “tape” as he called it, was the master for decision making and no other.
Let’s look at what the tape is saying about LABD, the 3X inverse EFT of Biotech (IBB).
The sector has already been traded profitably last week. Shown on the chart below is another entry. Also shown, is what may be the most efficient method for stop placement.
For LABD over the prior weeks, we could have extracted a large part of its move using a trailing stop based on the 4-Hour chart.
LABD itself has defined that 4-Hour looks best at this point in time.
So, that’s what we’ll do (not advice, not a recommendation). The stop will be at the nearest 4-Hour low (currently, 16.27).
At mid-session today, we’ll move it up to the next 4-Hour low and so on until stopped out.
Note: Posts on this site are for education purposes only. They provide one firm’s insight on the markets. Not investment advice. See additional disclaimer here.
At this juncture in the market, trades are only to the short side.
The one exception is the bond market.
With everything stretched to never-seen-before extremes and ready to break at any time, bonds are in position to rally.
This short-story of the biotech short actually begins with a bond loss.
Going back in time a bit; on Friday the 12th, a long position was opened in bonds via TMF. That action was documented in this post.
Then, we had the holiday weekend and the Texas freeze.
These posts are originating from a location near Ft. Worth Texas, where temperatures reached a low of -3 F.
At the office, we have backup power and physical (hard-wire) connection for internet. Both systems operated well as main power was cut repeatedly over a three-day period.
Those conditions are mentioned because at the open on Tuesday the 16th, transmission, execution and update times on trades were affected.
A potential harbinger of things to come.
Imagine a nation-wide outage where the market’s down 15-20% and still collapsing. All the while, trade platforms are locked-up with brokers inundated.
During that open on Tuesday, bonds (TLT) gapped-down which was unexpected. Inverse fund TMF was immediately down about -4.5%.
Overall, the bond market is still in position to rally. However, the open on Tuesday said ‘not yet’ and we’re not going to change the trading strategy to one of ‘hope’.
With trade execution times slow (minutes, not seconds), by the time a confirmation came in from the broker, exit on the position posted a -5.2% loss: A dent in the account for sure.
At the same time, we’re monitoring a large set of equities and markets.
So, the immediate task at hand was could that hit be mitigated quickly. Was there an opportunity in another market for gain?
The short answer was yes. It was in biotech to the downside.
Price action on the platform was slow to update. However, it was clear from what was available, shorting biotech via LABD was high probability.
That’s what happened. Entry was at LABD 14.73, about ten-minutes into the session.
Obviously, under the conditions, stress level during re-positioning was high. Temperatures in the trading office were about twenty-degrees below normal.
It’s hard to say exactly, but sometime as the last trade was being entered or confirmed, main power was cut again.
Subsequent price action on LABD was fast.
By the time we’re halfway into the session, not only has the loss been mitigated but the account is showing green. Good stuff.
The position and the account finished the trade in the green and the rest is history. Entry and exit are shown on the 15-minute chart below.
On the exit and in retrospect, the trade was held for a bit longer than it should have been as there was potential for additional upside.
When it became clear it was not to be, LABD was exited with an 8.21%, gain as noted:
Note: Posts on this site are for education purposes only. They provide one firm’s insight on the markets. Not investment advice. See additional disclaimer here.
Note: Posts on this site are for education purposes only. They provide one firm’s insight on the markets. Not investment advice. See additional disclaimer here.
Ever since the inland hurricane, the ‘Derecho’ of August 10th, it’s never been the same for corn.
Now, it’s going vertical.
The entire U.S. agricultural food supply infrastructure is being systematically dismantled. Control the food, control the population. Simple.
It seems the ‘preppers’ tend to focus on stockpiling silver and gold.
If your’re getting ready for what’s coming, from a historical perspective, that’s not the place to start.
Going way back …. thousands of years, during the famine in Egypt of Joseph’s time, we have this:
“And Joseph gathered corn as the sand of the sea, very much, until he left numbering; for it was without number”
“And the famine was over all the face of the Earth: and Joseph opened all the storehouses and sold unto the Egyptians: and the famine waxed sore in the land of Egypt.”
“And all countries came unto Joseph for to buy corn; because that the famine was so sore in all lands.”
Gen 41: Vs. 49, 56, 57, KJV
They paid for the corn first, with gold and silver. Then they paid with their livestock. Then they paid by selling themselves into life-long slavery. We can equate that last part (slavery) as getting the vax.
As corn is going vertical, the bond market is signaling its move as well.
Just now, today, TLT is rotating higher.
Yesterday, Steven Van Metre showed a chart (time stamp 10:00) of the speculators beginning to back off their historic short position.
They’ve figured out they’re trapped. Now, they’re trying to sneak out the door without being completely impaled on a sharp bond spike.
The S&P, Dow, NASDAQ, Russell 2000, all appear to be holding near their highs.
Note: Posts on this site are for education purposes only. They provide one firm’s insight on the markets. Not investment advice. See additional disclaimer here.
Markets press on, new highs. However, biotech (IBB) is losing luster.
It could be just a temporary blip on the road upward.
Or, there could be something else afoot not known to the general public … and possibly not even known to professional speculators and market traders.
The video link below is to an alternate (independent) platform. One among many popping up in response to ‘adjustments’ being made by YouTube.
The video at this link is nearly an hour long. It’s one of those things that upon viewing the entire presentation, one can never be the same.
Viewer beware. For those with short attentions, fast forward to Time Stamp 22:50, for the meat.
Wyckoff stated a century ago ‘the reason for a move is always revealed after the fact’; we might find if IBB reverses from here and does not look back, the link above may ultimately become the ‘reason’ for such a move.
Imagine if this presentation becomes widespread knowledge … where will biotech be then?
Of course, price action is always the final arbiter. Positions (and stops) remain unchanged.
Note: Posts on this site are for education purposes only. They provide one firm’s insight on the markets. Not investment advice. See additional disclaimer here.
Note: Posts on this site are for education purposes only. They provide one firm’s insight on the markets. Not investment advice. See additional disclaimer here.













 The Danger Point®