Break & Test: Biotech

Getting out of a non-performing position allows the mind to clear.

What we see now, is a massive terminating wedge pattern for IBB. 

That wedge had a trend line break September 3rd, on decisive volume.

The break is now being tested.  This is typical market behavior. Expandable chart of IBB, is here

It’s about thirty minutes before the open and pre-market activity shows IBB trading higher. 

The IBB, 50% retrace level is approximately ~ 136.20

IBB tends to move counter-trend during the first two hours of trade. 

If the trend is down and the market’s just testing, the (continuation) reversal lower may come around 11:30 a.m. EST.

Inverse funds (not advice, not a recommendation) are BIS (2X-inverse) and LABD (3X-inverse).

Charts by StockCharts

Note:  Posts on this site are for education purposes only.  They provide one firm’s insight on the markets.  Not investment advice.  See additional disclaimer here.

CORN: Breakout Higher

The agricultural food supply, and delivery systems are being destroyed systematically.

The fundamental picture for corn at this juncture, should be well known. 

Weather events, whether manufactured or not, are taking out huge (silo) stockpiles in addition to destroying what’s still in the fields.

The August 20th, update highlighted a CORN trend-line.

Since then, CORN price action has morphed into a trading channel.

We’re now at the right side and in position to move higher. A channel failure at this point would be obvious.

If CORN does not continue upward from here, the channel has lost its effectiveness and/or, the market has some other objective.

Biotech IBB: Update

Anything can happen. Price action reversed above the 23.6%, retrace, hit the 38.2% retrace and kept going.

Our result was to exit the (IBB), short position during today’s session.

We’re past the 38% retrace level which leaves 50% and 61.8%; Trading action is to stand aside (not advice, not a recommendation) for now.

Charts by StockCharts

Note:  Posts on this site are for education purposes only.  They provide one firm’s insight on the markets.  Not investment advice.  See additional disclaimer here.

Biotech: The Movie

Just before the all-time high in biotech (IBB), several screen shots of price-bar action were obtained.

Pasting it all together in an old-time flip-book format, we see the daily action of IBB over the past two months.

There’s no bonafide indicator that a top was imminent other than increased daily volume at the pivot. 

That increased volume was a subtle clue more volume was not resulting in upward movement.

The next day, price action stalled and reversed.

The result is obvious but below the radar.  IBB has not declined significantly enough, fast enough to draw outright attention.

This is precisely (not advice, not a recommendation) the area where Three Ten Trading established its short position.

In fact, as detailed in this update, the entire short position was exited and then re-established during this two-month long reversal.

The short position (via BIS) is now well in the green but ready to be exited at the first sign of trouble … all the while expecting further IBB downside ahead.

TC2000 Charts courtesy of Worden Brothers, Inc.

Note:  Posts on this site are for education purposes only.  They provide one firm’s insight on the markets.  Not investment advice.  See additional disclaimer here.

Biotech Hit & Run

It’s one hour before the close; biotech is hitting multiple technical flags simultaneously.

The weekly chart below, shows IBB retracing to Fibonacci 23.6% of its move from the July top.

Then it reversed.

Such a shallow 23.6%, retrace, where 38.2%, and 50%, are more common, indicates severe weakness. 

It’s a harbinger of lower prices ahead.

In today’s session, just minutes ago, IBB posted an outside down (key reversal) daily bar. 

So, we have a daily reversal within a larger, weekly reversal.

To make it technically correct for outside down, IBB would need to close below yesterday’s low of 127.99. So, we’ll see.

The short (not advice, not a recommendation) position via BIS, implemented by Three Ten Trading, has not changed.  In fact, the short position has been increased since the last post.

There’s been no major break in IBB, yet.  No air pockets, no negative news announcements.

As Livermore said a century ago (in 1923), ‘surprises happen in the direction of trend’.

The trend of IBB is down.

Let’s see what happens next.

Charts by StockCharts

Note:  Posts on this site are for education purposes only.  They provide one firm’s insight on the markets.  Not investment advice.  See additional disclaimer here.

Straight-Down: Biotech

Not happening: Do not pass Go.  Do not collect $200 dollars.

From the open, IBB headed straight down; decisively penetrating support at the 130.00 – area.

Next potential support and a possible chance of a rebound, is around 125.00.  At this point, it’s not looking good.

Right now, volatility is high.

The low risk part of this move, that is, price action over the past three months, is over.

Another low-risk (short) entry point may never happen.  Biotech could just collapse from here. 

Remember, Stockman’s quote:  ‘It’s $2-Trillion of bottled air’.

Since were following the tenets set down by the market masters linked here, we’ll sit tight at this point. 

A reasonable stop level for BIS (2X, inverse ETF) can now be moved to around 33.50. For illustration only. Not a recommendation. Not financial advice.

Charts by StockCharts

Note:  Posts on this site are for education purposes only.  They provide one firm’s insight on the markets.  Not investment advice.  See additional disclaimer here.

Better Than Expected: Not Really

It’s just after the market open and there’s better than expected news on employment. That is, until you factor in temporary Census workers, skewing data to the upside. 

The Money GPS has long been providing real data and analysis (for years) on the market’s end-game.  Time stamp 7:24, at this link identifies the boost in employment numbers resulting from (Census worker’s) temporary hiring.

All this brings us back to price action.  What is the market saying about itself?

For biotech, there’s a possibility for a rise into a Fibonacci retrace level during this session. The hourly chart below, captured just three minutes after the open, shows the action thus far.

From empirical observation, IBB exhibits behavior where stop running, equalization of forces are complete around 11:30 a.m. EST. 

Depending on general market forces (S&P 500), if there’s going to be a reversal, it typically happens at (or before) that time.

If the down-trend is to continue, we’re looking for a test and reversal at either the 28.6%, or 38.2%, retrace level.

If or when that happens, it will be the trader’s discretion (not a recommendation) to either enter a short position or increase an existing position … or stand aside.

Note:  Posts on this site are for education purposes only.  They provide one firm’s insight on the markets.  Not investment advice.  See additional disclaimer here.

All But One

Of the nine market indices listed below, only one has a bearish weekly MACD cross-over:  Biotech

IYM:  Basic Materials
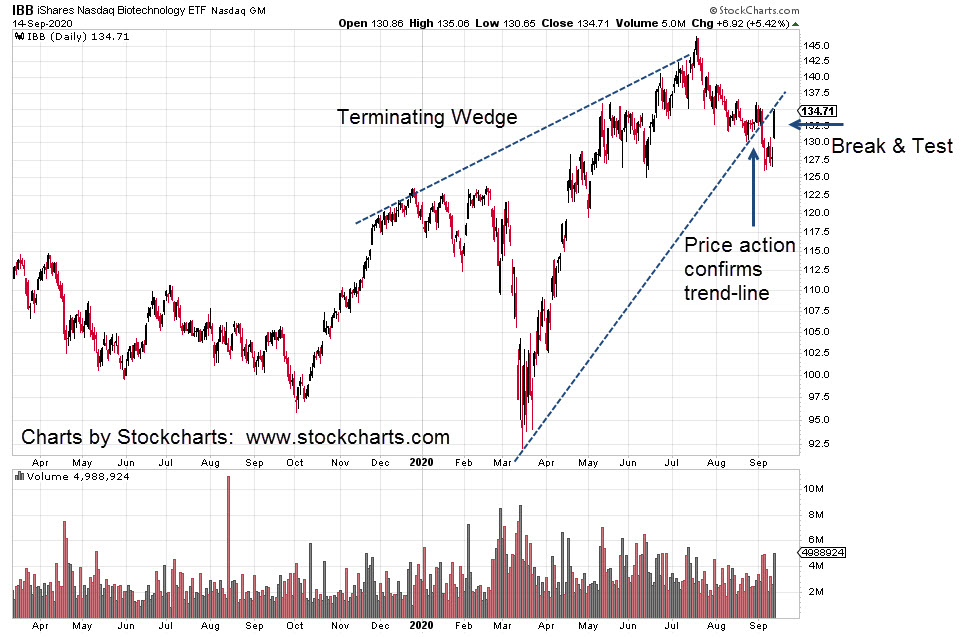
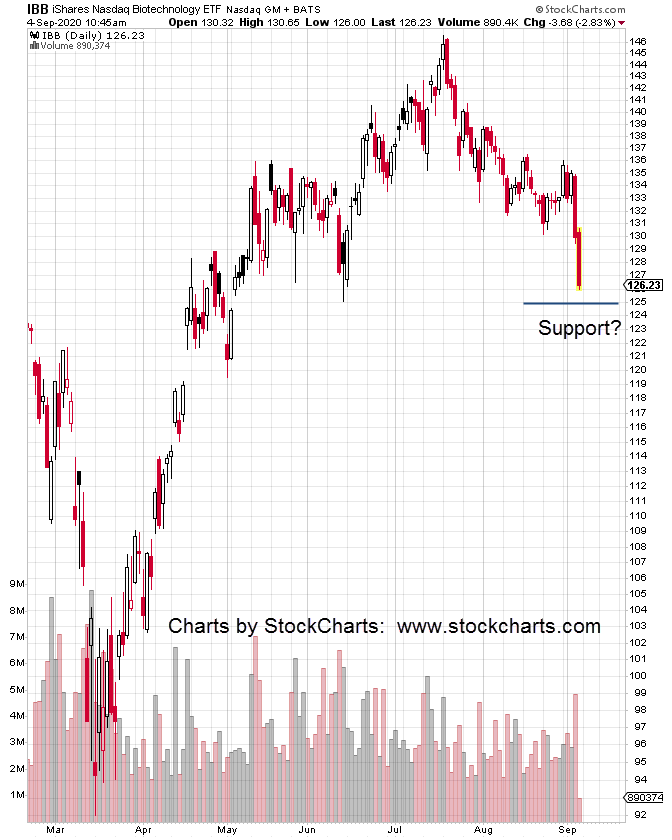
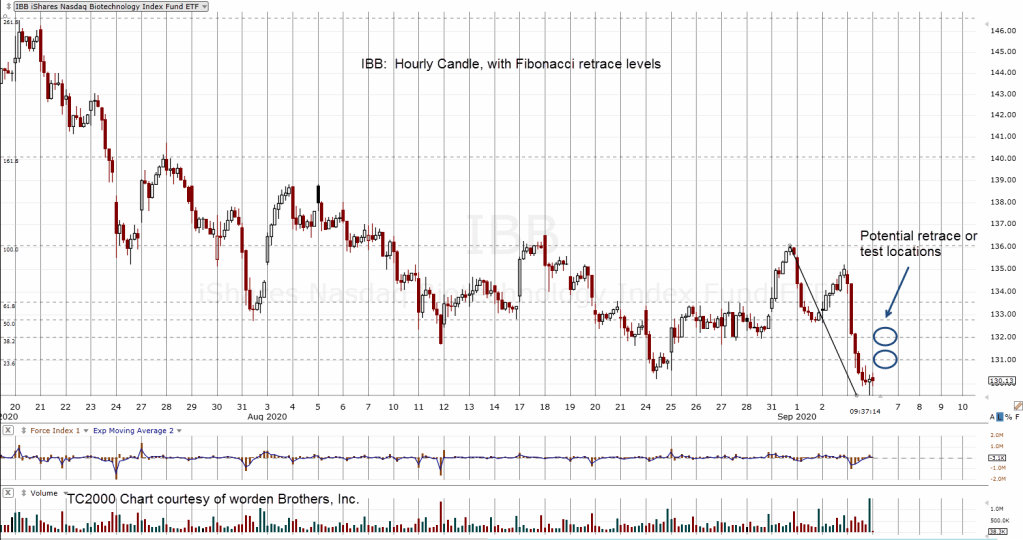
IBB:  Biotech

DIA:  Dow 30

IYT:  Dow transports

QQQ:  NASDAQ 100

IYR:  Real Estate

IWM:  Russell 2000

SOXX:  Semiconductors

SPY:  S&P 500

Yesterday, the indices were are at all time highs except for real estate (IYR), biotech (IBB), and Russell 2000 (IWM). 

Looking at IYR and IWM, we can see, although they are below the high, there’s still a persistent up-trend.

Even with today’s on-going reversal (three-hours before close), only biotech has posted a bearish, weekly MACD cross-over.

Of course, it won’t be known until after the fact why biotech is unique.  A hint at what might be the reason, is here (if it’s still available).

A gallery of the weekly index charts, listed above (as of 9/2/20) can be found here.

The focus of this firm, since June 3rd, exactly three months ago, has been biotech and its impending reversal.

A significant short position has been established over those three months via BIS, the 2X, inverse fund. Current Stop: 32.18

So, just what is ‘significant’?  How big is that?

To be transparent, without giving specifics, avoiding the usual internet keyboard warrior, and/or hater, the position is as follows:

We’re short what amounts to a full year’s wage for the typical American worker.  Fair enough?

When the position is closed out, results will be posted on the company site, located here.

Note:  Posts on this site are for education purposes only.  They provide one firm’s insight on the markets.  Not investment advice.  See additional disclaimer here.

Prepping For The Downside

The more sophisticated market participants work the downside.  That’s where the biggest (and fastest) money is made.

shutterstock_242289160Trading books and specifically Reminisces of a Stock Operator, (first published in 1923) detail how the wealthiest traders in the world prefer downside action.

The markets are now stretched to obscene levels and could go higher, still.

Just this past week, we have interest rates breaking out to the up-side, a-la August, 1987.

Being long anything other than corn or wheat and the occasional down-trodden coal miner,  seems to be a high risk plan (not a recommendation).

Positioning for the downside in the appropriate market, might be a lower risk option than riding the insanity to the top … wherever that is.

Which brings us to inverse biotech fund, BIS.  The daily chart shows the well-heeled know something’s up.

2020-08-30_9-32-52-IBB-Daily-5-bar-lanscape-notes
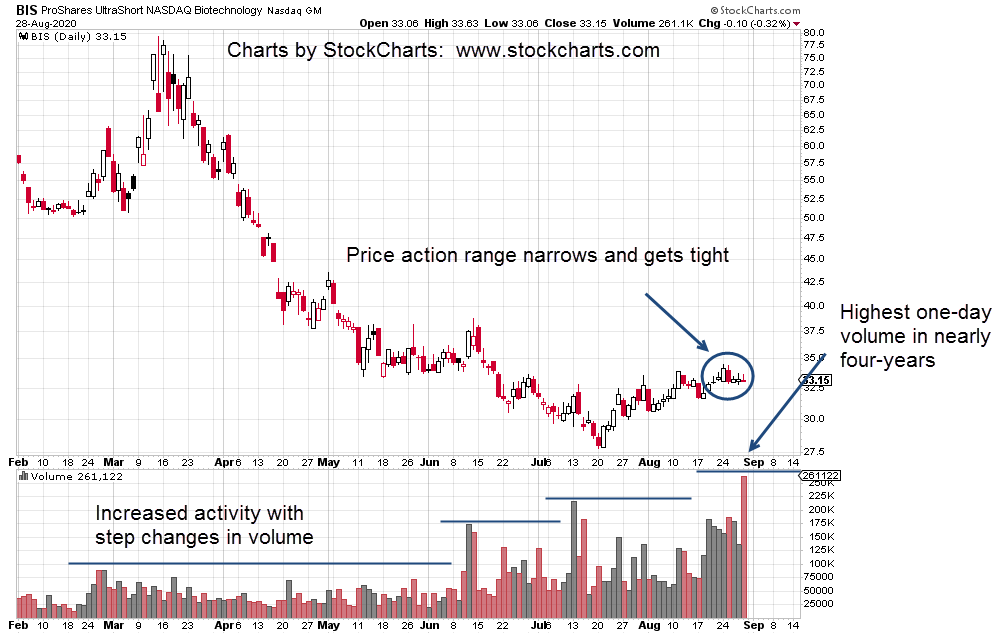
Speculative volume for potential downside in biotech is increasing.  Last Friday’s volume in BIS was the highest in nearly four years.

BIS was trading higher throughout the entire session until the last few minutes.  It closed slightly lower for the day and thus colored the volume bar red.

That minor BIS downturn (up turn in IBB) can be traced directly to Amgen (AMGN) which is now part of the Dow 30, effective Monday the 31st.

It’s important to note that for the past four months, volume activity in IBB has remained relatively unchanged.  Not so with BIS.

We’re nearing the Labor Day Weekend during the next sessions.  The market will be closed on Monday, September 7th.

Back in the day of 1929, the market made its all time high on September 3rd, the Tuesday after the Labor Day Weekend.


Charts by StockCharts

Note:  Posts on this site are for education purposes only.  They provide one firm’s insight on the markets.  Not investment advice.  See additional disclaimer here.

Hulking Shell

That’s what the average investor’s portfolio could be a scant two months from now if the analysis is correct.

Fotosearch_k7478570-BW-border

That is; markets are stretched to obscene levels, bonds breaking down, rates rising; the nearest corollary is August, 1987.

From a timing standpoint, it could be important.  That August was a Fibonacci 34 (-1) years ago.  Well within the margin of error.

Yesterday’s trade set-up (not a recommendation) was timed perfectly.

Today, that trade (if entered) would be up by about 2.8% at current levels.  The stop now gets moved to 15.54, today’s low.  Of course, this is for illustration purposes only.

For a bond trade, 2.8% is significant for a single day.  It looks like much higher rates are ahead.

Meanwhile, biotech (IBB) has given yet another sell, sell-short signal.  IBB briefly penetrated yesterday’s high of 133.39, and is reversing.

If price action continues lower, it’s a bull trap; a false breakout.

We’re actively short the sector via BIS (not a recommendation).

2020-08-27_11-53-45-TBT-Daily-5-bar-notes

Charts by StockCharts

Note:  Posts on this site are for education purposes only.  They provide one firm’s insight on the markets.  Not investment advice.  See additional disclaimer here.