Biotech: Upside Breakout

Wedge patterns are the end of the line.  They typically come after a sustained move whether it’s up or down.

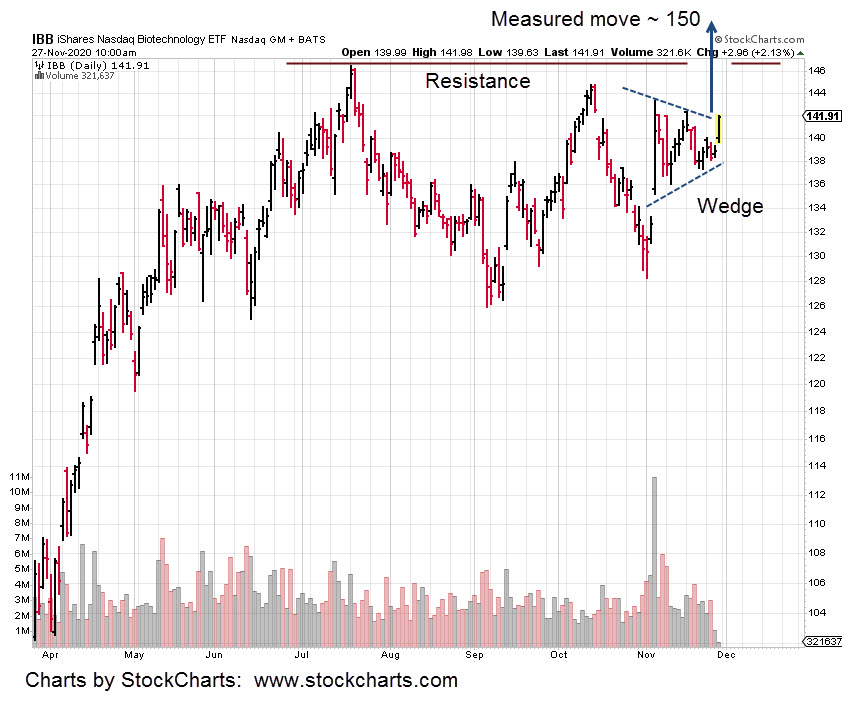
IBB has been oscillating and coiling for weeks.

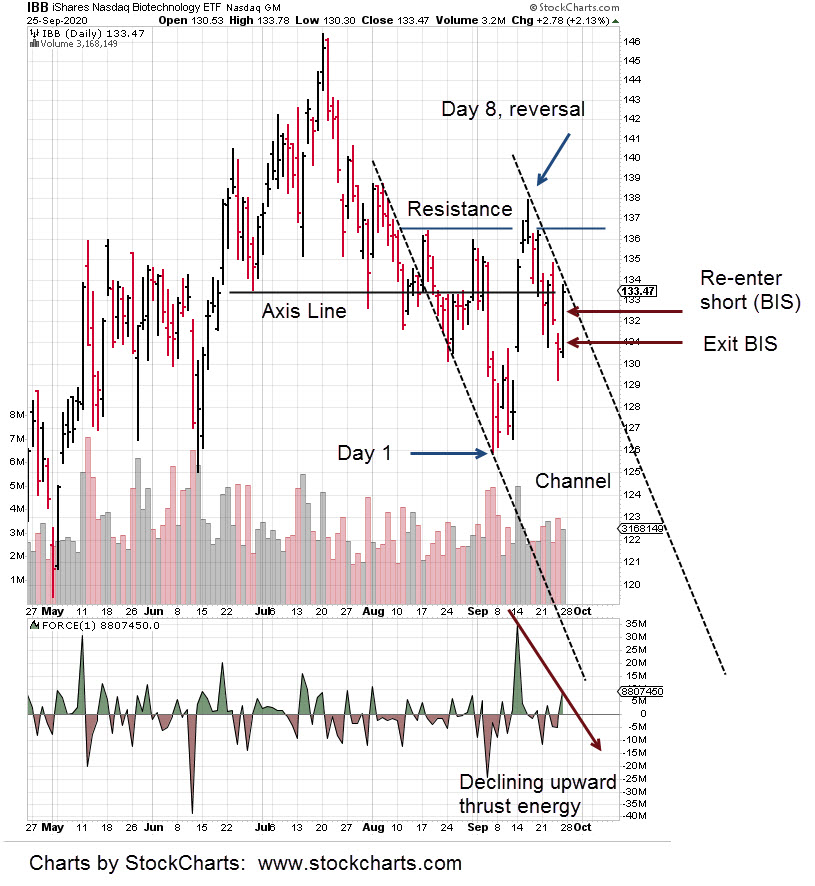
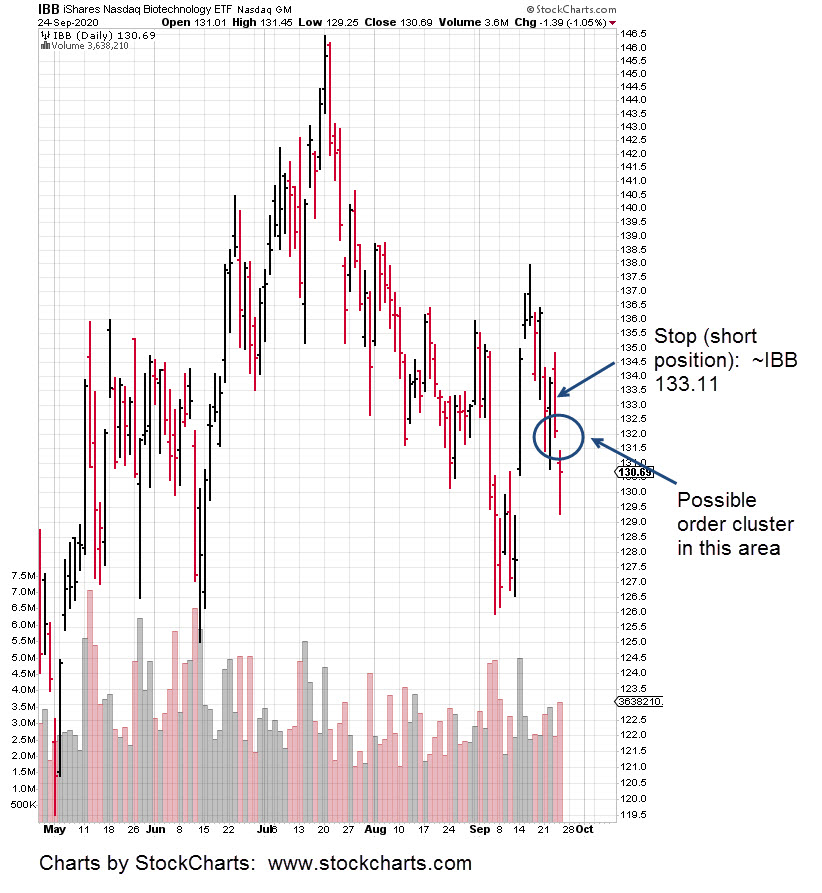
The last trade in this sector was a short position (via BIS), opened October 14th, then closed the next day for a gain slightly higher than 4%.

Back then, the thinking was IBB is to make new highs just before the election (in turn posting a bearish MACD on the weekly) and then reverse.

It didn’t happen.

This is the way of the markets.  Setups begin to form, come to fruition or fade away. 

Contrary to what the advertisements say (to lure the uninitiated), you don’t “work five minutes a day” and achieve phenomenal success.

It’s just another lie … at this point we should all be used to that. 

If IBB continues higher in a measured move to the 150-area, it will push past resistance and post all time highs in the process. 

It could set up for a bearish MACD divergence as well.

If and when this happens, depending on price action, we might see another low-risk area for a short position.

Stay Tuned.

Charts by StockCharts

Note:  Posts on this site are for education purposes only.  They provide one firm’s insight on the markets.  Not investment advice.  See additional disclaimer here.

Amgen: Head & Shoulders

Like Newmont is to GDX, so is Amgen to IBB. 

It’s the heavy hitter. If we decipher what’s going on with it, then we can trade biotech for (potential) profit.

The chart shows price action began to retrace off the lows for the week.  In doing so, it created a possible neckline.

The 38% retrace area, marked with the dashed line, also shows it’s a juncture between weekly bars; the circled area.

That’s a trading tip … watch the circle.

If price action gets to 38% and stalls, it shows weakness. 

Our interest is to look for shorting opportunities.  Specifically, via the 2X Inverse Biotech, BIS. 

For years now, except for energy (nat-gas) and commodities (corn, wheat, et al), markets are being worked from the short side.

Steven Van Metre presents an excellent case for a deflationary impulse first before there’s any inflation.

The ‘macro’ as he calls it, provides a backdrop for what’s really going on. 

For now, the action (not advice, not a recommendation) is to watch AMGN play out.  If the trading is choppy, overlapping and laboring into the 38% level, then we have our answer.

Charts by StockCharts

Note:  Posts on this site are for education purposes only.  They provide one firm’s insight on the markets.  Not investment advice.  See additional disclaimer here.

Lying In Wait

That’s exactly what’s happening with biotech (IBB) and more specifically Amgen (AMGN).

Just like with Newmont and GDX from the previous update, Amgen’s the heavy hitter for the biotech sector.

What we see on the daily chart below and expandable version here, is that AMGN’s at the danger point.

Price action penetrated well established support and then stopped dead (so far).

If that’s the case, we’re looking for price action to rebound and move toward the 242 – 244 area; a 50% retrace from current levels.

If that point is reached, depending on the behavior of price action itself, the expectation is for a long-term reversal.

There have been several trades using BIS and LABD with the overall result being about break-even to slightly down.

More important than outright profit is the trading insight (over several months) into the sector itself.  That insight can only come from active positions. 

No amount of ‘paper trading’ or external analysis will provide a visceral feel for the market.

Summary: 

We’re waiting for price action in AMGN and the overall IBB, to counter-trend upward as we head into November.

If there’s an obvious reversal at that time (not advice, not a recommendation) the risk on a short position may be at its lowest.

Charts by StockCharts

Note:  Posts on this site are for education purposes only.  They provide one firm’s insight on the markets.  Not investment advice.  See additional disclaimer here.

Biotech: Election Top Closer

The October 4th, update proposed a top and reversal for Biotech (IBB) at or near the election.  November, 2nd , or 3rd, could be new highs followed by an immediate reversal.

Fibonacci week 34, from the 3/16/20 lows, is the week ending on Friday, November 6th.

The daily chart (below) has a trend that’s been confirmed; If it remains intact for the next three weeks, it will lead us straight to new highs at the beginning of November.

Following price action in this way allows for preparation. 

Timing, position size and stop levels can be (and must be) planned in advance. Not a recommendation, not financial advice.

The topping formation in biotech has been followed and traded (via BIS and LABD) by this firm since early June. 

Doing so, forces one to be accustomed to the behavior of the sector. 

Behaviors such as counter trend action in IBB, tends to be complete and resume original trend, right around the 10:00 a.m. to 10:30 a.m. time-frame.

That’s a data nugget that can’t be obtained by parachuting into a sector, taking a position and hoping it all works out.

A perfect (short) trade set-up would be for price to gap-higher into the 2nd, or 3rd (November) and allow for an entry with a well defined stop … such as the top of the gap-bar.

Of course, at the open this Monday, IBB could break the trend-line and create an alternate scenario … anything can happen.

However, at this point, probabilities and momentum (although waning) favor continuation upward.

Charts by StockCharts

Note:  Posts on this site are for education purposes only.  They provide one firm’s insight on the markets.  Not investment advice.  See additional disclaimer here.

Biotech breakout … Will it hold?

As with natural gas, UNG discussed here, IBB is also at a danger point.

Price action penetrated resistance and closed above that resistance; giving the appearance of strength.

The chart shows Fibonacci time correlations.  Biotech, IBB appears to have form and time structure.

To use Wyckoff parlance, IBB is in an up-thrust; a potential reversal condition.

It’s true that a weekly time correlation appears to be in effect as well; At least at this juncture.  However, it’s price action itself that’s the final arbiter.

If there’s a retrace below support, then a test (form the underside), we’ve got a good indication of reversal

Charts by StockCharts

Note:  Posts on this site are for education purposes only.  They provide one firm’s insight on the markets.  Not investment advice.  See additional disclaimer here.

Peabody (BTU) Trending Higher

Those late to the game on BTU may have cashed out with losses on Friday, September 25th.

So-called ‘expert’ (buy) opinion came out on the 17th and since then BTU has declined anywhere from -8%, to -27%.

We exited our BTU long on the 18th, with a 15.5%, gain.

Now, we see BTU contacting a nascent trend-line.  There could be a trading channel formed as well.

If BTU maintains the trend, it’s rising approximately +3,000%, annualized.

At that rate, a 100% gain on a long position (not advice, not a recommendation) would take about six-weeks.

In other markets, biotech (IBB) pre-market action shows a higher open.  If that’s the case, we’ll exit (not advice, not a recommendation) the BIS position and stand aside.

Update: 9:54 a.m. EST: IBB is reversing immediately from its open. BIS position maintained (not advice, not a recommendation) at this point.

Update: 2:39 p.m. EST: BIS exit @ 31.591

Charts by StockCharts

Note:  Posts on this site are for education purposes only.  They provide one firm’s insight on the markets.  Not investment advice.  See additional disclaimer here.

Biotech Short: Technical Discussion

Short out, short in. That was the trade action for Friday, the 25th.

The pre-market update hinted price action would rise; taking out stop orders at the area shown.  IBB did just that and more.

Early in the session, within about thirty minutes it was obvious that we’re moving higher. The BIS position was exited at 33.10.

Profit on the short, held for ten days was about 6.5%.

Price action continued to rise throughout the day. Late in the session, the short was re-established via another position in BIS.

Not expected, was that IBB continued to move higher into the close of the day. 

BIS moved correspondingly lower.

The position is showing a slight loss of -1.5%.  This amount is well within risk parameters but does require that IBB opens lower and moves lower at the next session.

The chart, with an expandable version here, shows we’re at the top edge of an established trading channel. 

Force Index, upward thrust energy has declined while at the same time price action finished the day right at the axis line shown.

There’s also a Fibonacci time sequence as noted.

The expectation is for a lower open and lower action during Monday’s session.

If price action opens higher, the short-covering scenario as identified in this update, is not in effect; the short position will be closed.

Charts by StockCharts

Note:  Posts on this site are for education purposes only.  They provide one firm’s insight on the markets.  Not investment advice.  See additional disclaimer here.

Amgen At The Edge

The market itself has decided the lower wedge-line is important.

Price action penetrated, then recovered, penetrated again and is now testing the underside.

This oscillation about the line validates its existence and confirms its importance.

AMGN is at the danger point.  Price action can go either way.

Higher, and the wedge has been negated.  Lower and we may have a strategic, long-term reversal.

Separately, the short position via BIS at the trader’s discretion was exited early during Friday’s session.

When it’s obvious, we did not wait around for the stop.

The total profit on the short, held for just ten days, was about four-weeks pay for the typical American worker.

Why list it in those terms? 

With at least 30% of the population out of work and no job in sight, would it not make sense to show how proper research, experience and training may replace some of the lost income?

Getting back to the biotech short position; Later in the session, as IBB was rising, BIS declining, the short was re-established.

More on that entry is planned for tomorrow’s discussion.

Charts by StockCharts

Note:  Posts on this site are for education purposes only.  They provide one firm’s insight on the markets.  Not investment advice.  See additional disclaimer here.

Biotech, Short Stop

It’s about 20-minutes before the open.

For those monitoring the short trade in biotech (IBB), the stop has been moved (not advice, not a recommendation) to the area around IBB, 133.11.

This is the middle of the trading range from September 23rd.

There may be orders hiding right around IBB 132.00 – 132.40 and the market could attempt to search these out.

We’ll see.

Annotated chart below:

Charts by StockCharts

Note:  Posts on this site are for education purposes only.  They provide one firm’s insight on the markets.  Not investment advice.  See additional disclaimer here.

Trending: Biotech

Today’s action may be in a trading channel.

It’s a Fibonacci eight days from the low of September 4th, to the top on the 16th.

That time correlation, along with the channel hits, help to provide validity to the set-up.

Our short position in the sector has not changed appreciably.  There was a slight backing off yesterday, by reducing the size about one-percent.

However, during today’s action as IBB was making intraday highs (BIS making lows), the short position was increased, via BIS.

In any event, we have a hard stop at the day’s high, IBB 134.85, which is approximately 31.46, on BIS:  Not financial advice, not a recommendation.

As of this post, 7:00 p.m., EST, the S&P 500 futures are trading down about -0.50%, giving the inference that downside action will continue at the next session.

Silver futures have dropped another 4.5% – 5%. Price action’s heading straight down.  Nearest chart support for the SIZ20 (December) contract is around 20.00.

Charts by StockCharts

Note:  Posts on this site are for education purposes only.  They provide one firm’s insight on the markets.  Not investment advice.  See additional disclaimer here.