Note: Posts on this site are for education purposes only. They provide one firm’s insight on the markets. Not investment advice. See additional disclaimer here.
Note: Posts on this site are for education purposes only. They provide one firm’s insight on the markets. Not investment advice. See additional disclaimer here.
While Carvana’s set for all-time highs on Monday, the opposite side of the sector, auto parts, have already rolled over.
Both AutoZone and O’Reilly reached their peak(s) this past September.
Then, last week, both of them posted an outside-down (reversal) bar.
O’Reilly is the more liquid of the two; we’ll review it first.
O’Reilly Automotive, ORLY, Daily
With a potential downtrend line (dashed blue-line), we’re currently hovering at minor support (dashed grey line).
Fibonacci time correlations are apparent.
As said before, as soon as everyone ‘figures it out’ (i.e., 1, 2, 3, 5, 8, 13, 21, ….), time correlations morph into chaos, or re-appear later (i.e., 55).
Note: Fibonacci 8-Days, between major downward thrusts.
Note: Posts on this site are for education purposes only. They provide one firm’s insight on the markets. Not investment advice. See additional disclaimer here.
Inclusion in the S&P notwithstanding, ‘fundamentals’ for Carvana have not changed.
Here’s a recent report on what’s happening behind the scenes. Note: In the comments section, one reply suggests the assessment of CVNA is ‘overblown’, ‘dramatized’.
From a Wyckoff analysis standpoint, it doesn’t matter.
The tape itself will let us know, if or when there’s a change of character (not advice, not a recommendation).
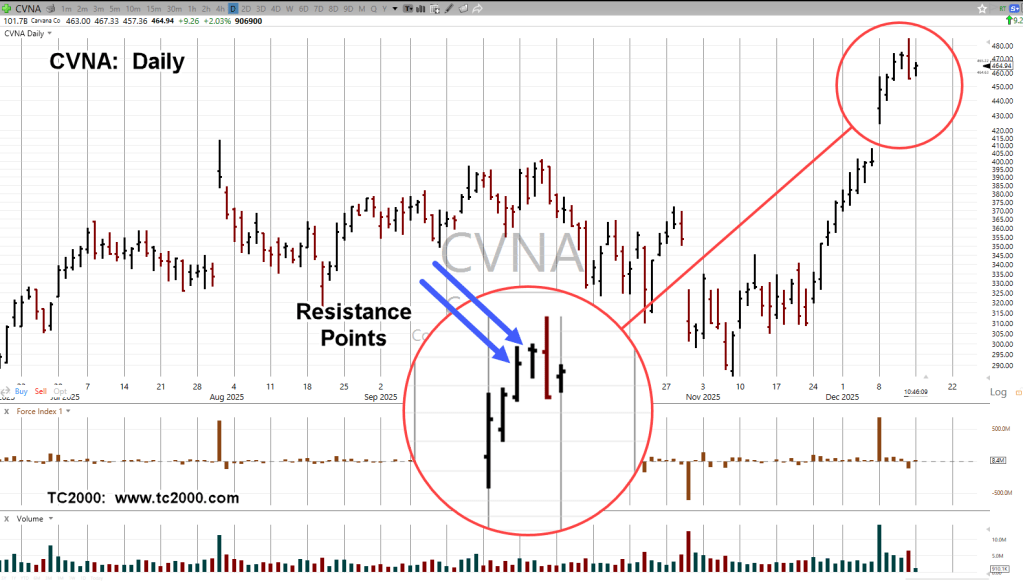
Carvana CVNA, Daily
After-hours high, was 450.00
Just in the past four months, APP, HOOD, and now, CVNA have been included in the S&P.
Note: Posts on this site are for education purposes only. They provide one firm’s insight on the markets. Not investment advice. See additional disclaimer here.
Note: Posts on this site are for education purposes only. They provide one firm’s insight on the markets. Not investment advice. See additional disclaimer here.
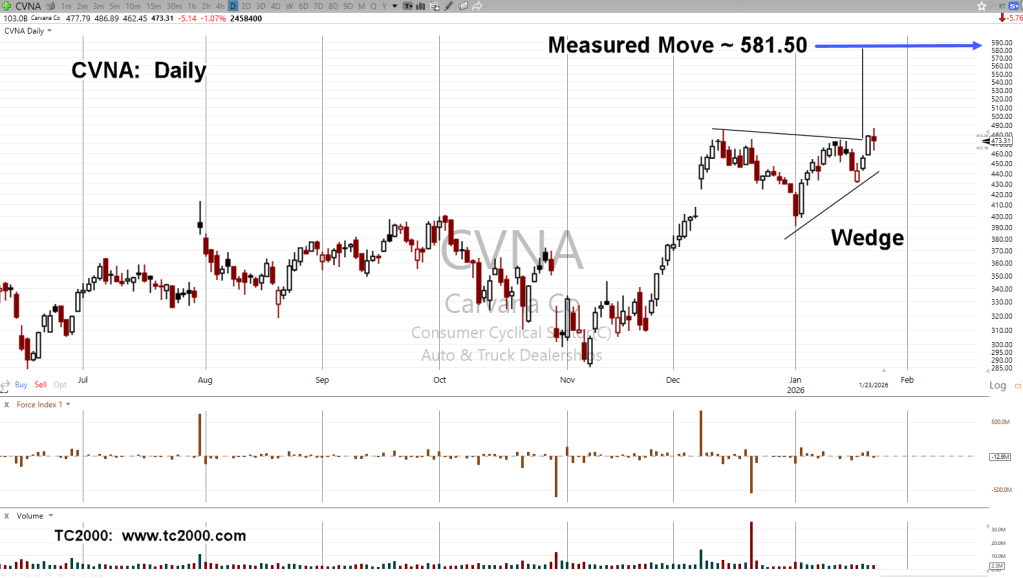
Carvana, launched itself above resistance at Friday’s close. In so doing, got itself into another wedge.
Now we have Expedia, looking eerily similar (not advice, not a recommendation).
Like eBay, we’ll start with the long term, quarterly chart.
Expedia EXPE, Quarterly
The latest earnings release pushed EXPE up, contacting the upper trendline.
A gap higher and close of +17.55%, in one day.
EXPE has since backed off the all-time high; currently down about -8.5%.
Edge of The Wedge
The following is a partial list of tickers either forming a (monthly) terminating wedge, or have broken out to the downside (not advice, not a recommendation)
Note: Posts on this site are for education purposes only. They provide one firm’s insight on the markets. Not investment advice. See additional disclaimer here.
Note: Posts on this site are for education purposes only. They provide one firm’s insight on the markets. Not investment advice. See additional disclaimer here.
Note: Posts on this site are for education purposes only. They provide one firm’s insight on the markets. Not investment advice. See additional disclaimer here.
Note: Posts on this site are for education purposes only. They provide one firm’s insight on the markets. Not investment advice. See additional disclaimer here.
Note: Posts on this site are for education purposes only. They provide one firm’s insight on the markets. Not investment advice. See additional disclaimer here.