Loss Of Upside

‘He’s Dead, Jim!’
While we can’t officially declare biotech dead like ‘Bones’ Dr. McCoy, we can say the charts below, paint a less than bullish picture.
The XBI, is so packed full of nuances, it needs at least two charts.
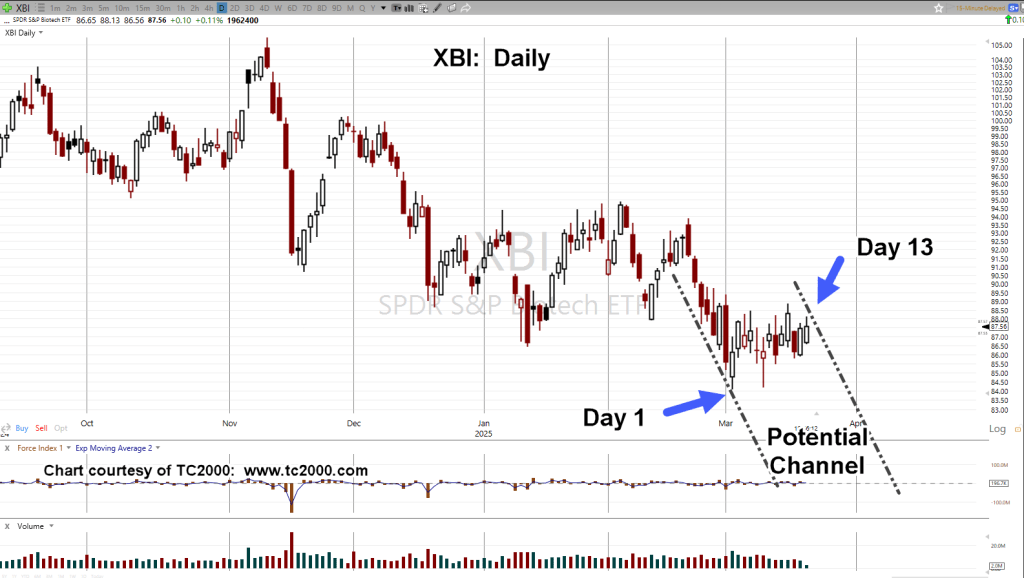
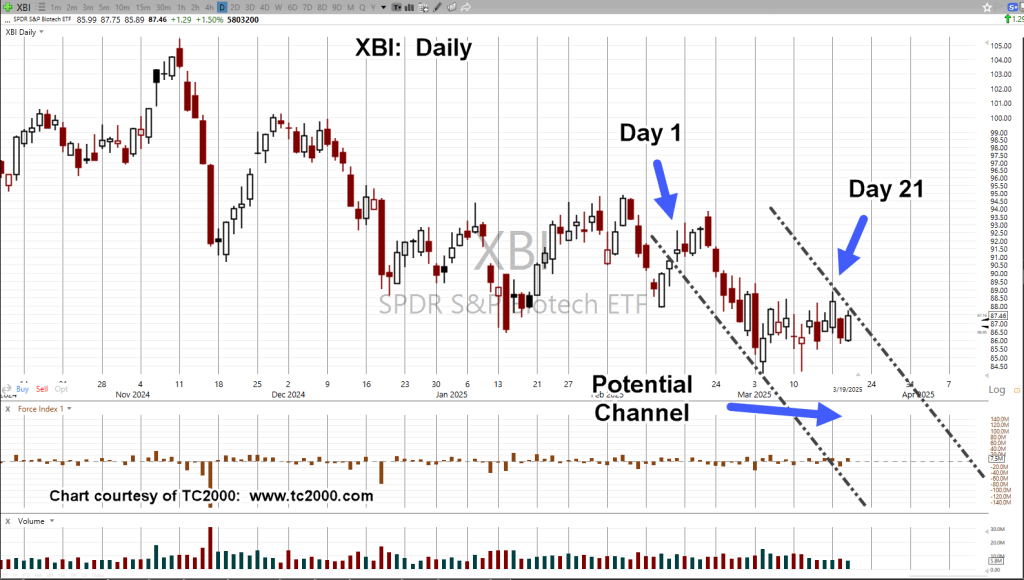
Biotech XBI, Daily
First, apparent weakness.
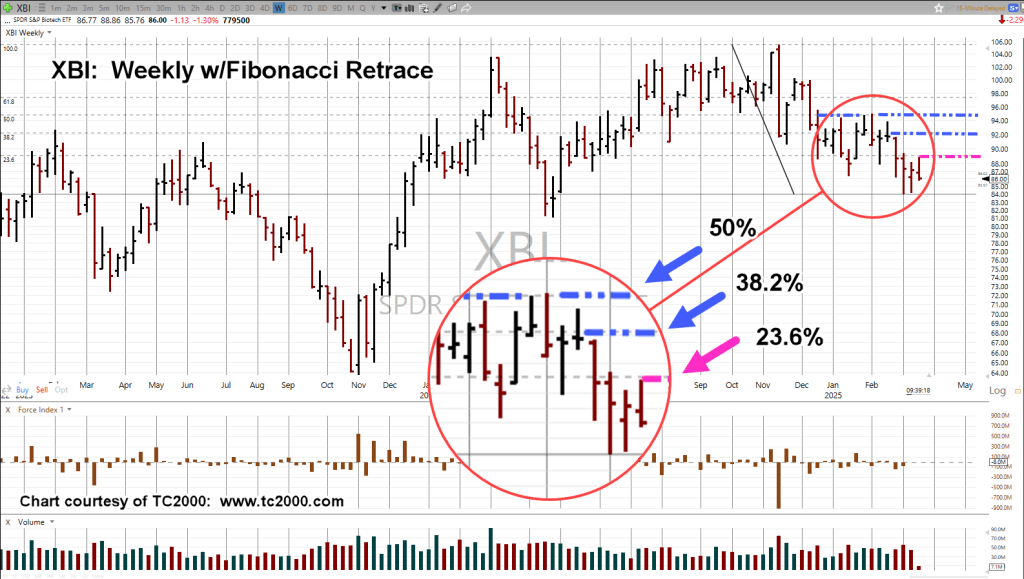
Price action’s only been able to retrace 23.6%, after penetrating support (blue line) and forming a Wyckoff ‘spring’ set-up.
On the far right, just below the magenta line, the grey lines show a minor up-thrust (reversal).
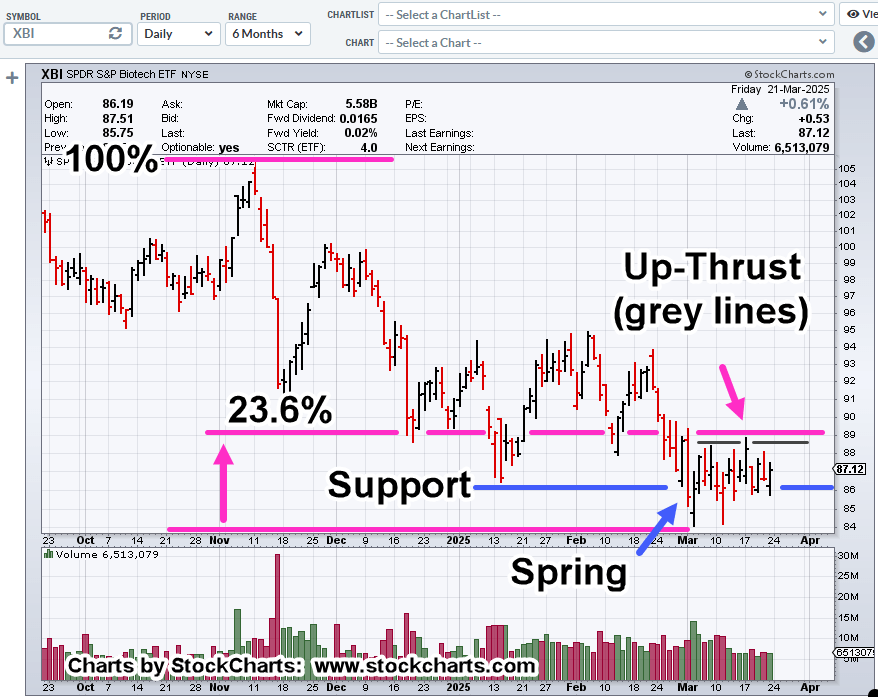
Next, we have a series of spring set-ups, that have failed.
Each time a spring condition is created, price action rises for a brief period, then collapses.

At the far right, the spring (shown in the first chart) appears to have failed; now subdividing lower.
Positioning
During Friday’s session, as price action began to rise unexpectedly, short LABD-25-03, was closed.
Then, late in the day after XBI appeared to have reached its high and reversed, a new short position, LABD-25-04, was opened (not advice, not a recommendation).
Obviously, the expectation for the coming week, is XBI to continue lower.
Stay Tuned
Charts by StockCharts
Note: Posts on this site are for education purposes only. They provide one firm’s insight on the markets. Not investment advice. See additional disclaimer here.
The Danger Point®, trade mark: No. 6,505,279