Expect ‘AI’, Hype To Increase

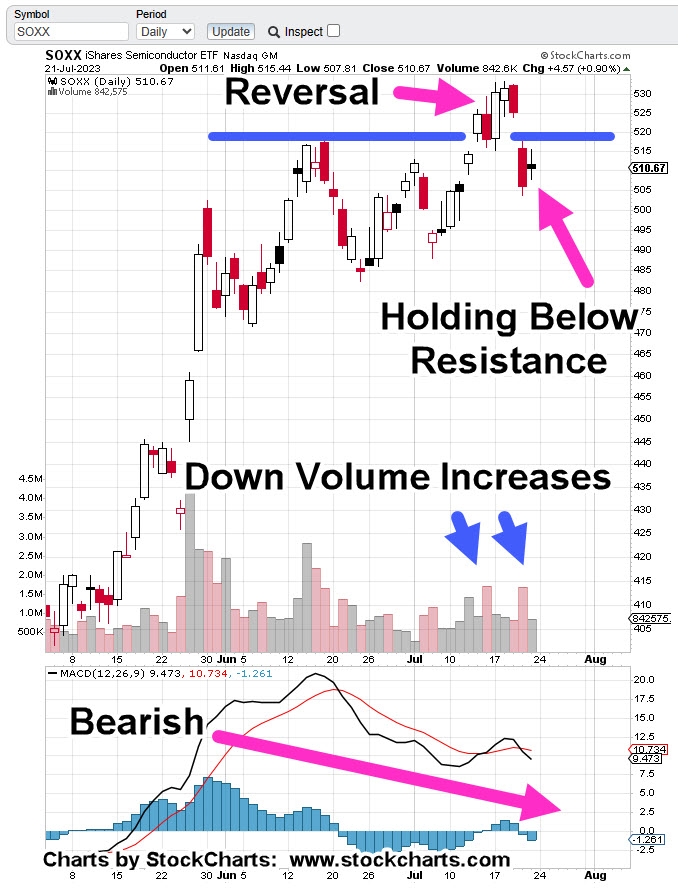
Distribution On The Way Down

If we’ve reversed from the top on the AI roadshow, expect the ‘easy money’ hype, to increase as price action heads lower.

It should be all too familiar; it’s a buying opportunity, the consumer is strong, the economy is strong … so, it goes.

The new, young, or uninformed ‘investor’, continues to average down, believing the hype; whatever’s happening to the downside, is just temporary.

Eventually, those participants start to sell.

Selling slowly at first, but then gathering steam. Those incorrectly positioned, provide the fuel for more downside.

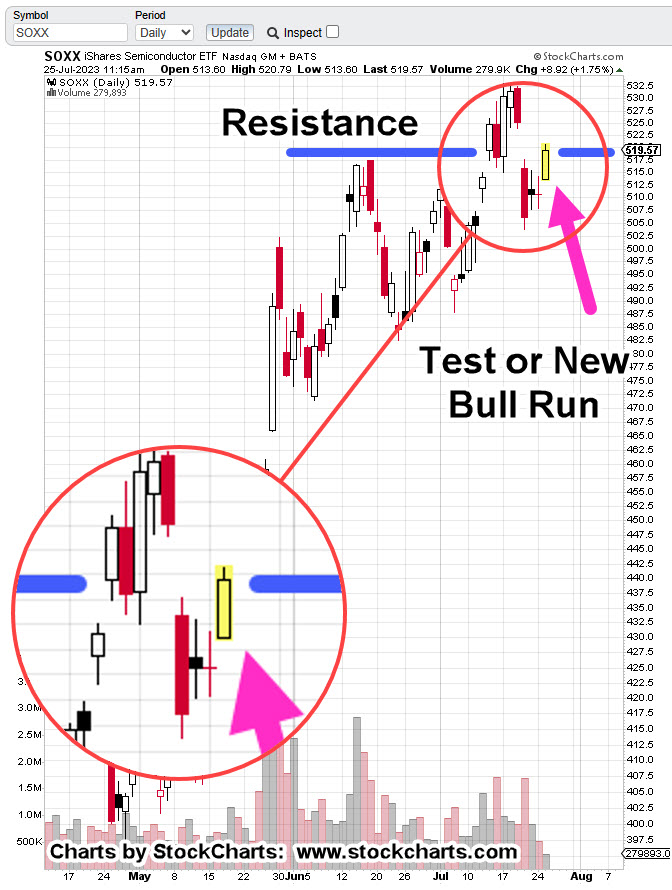
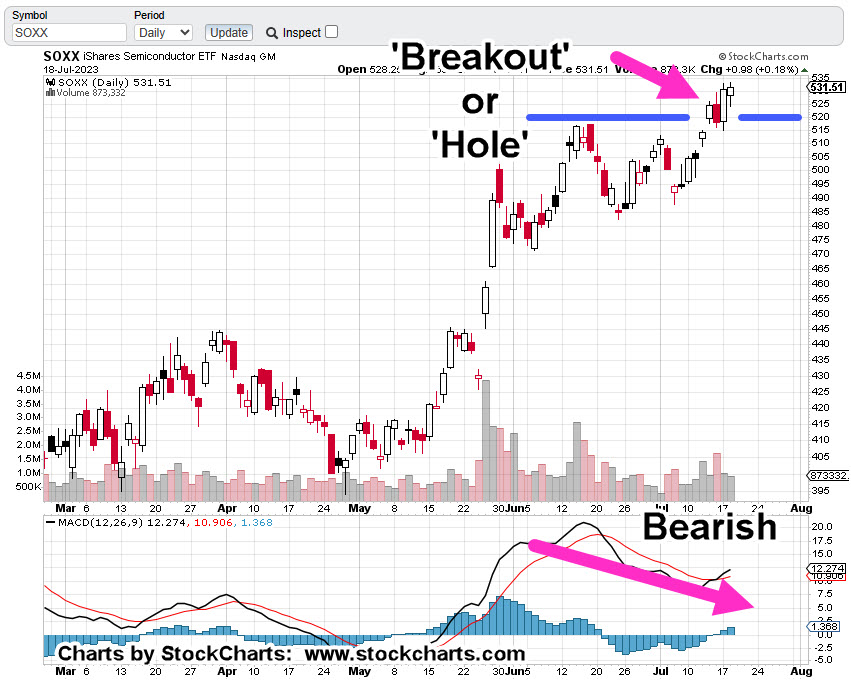
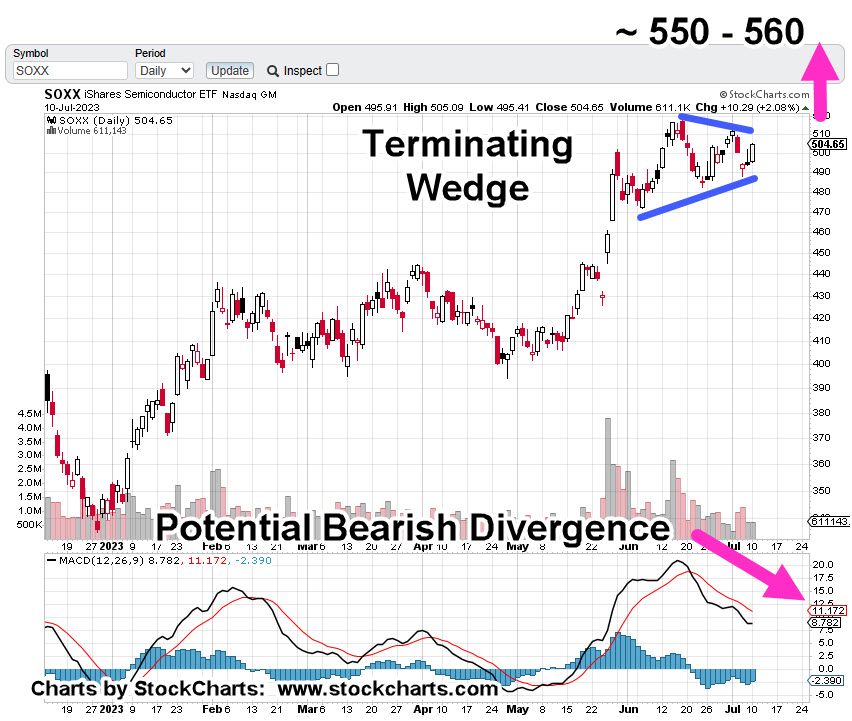
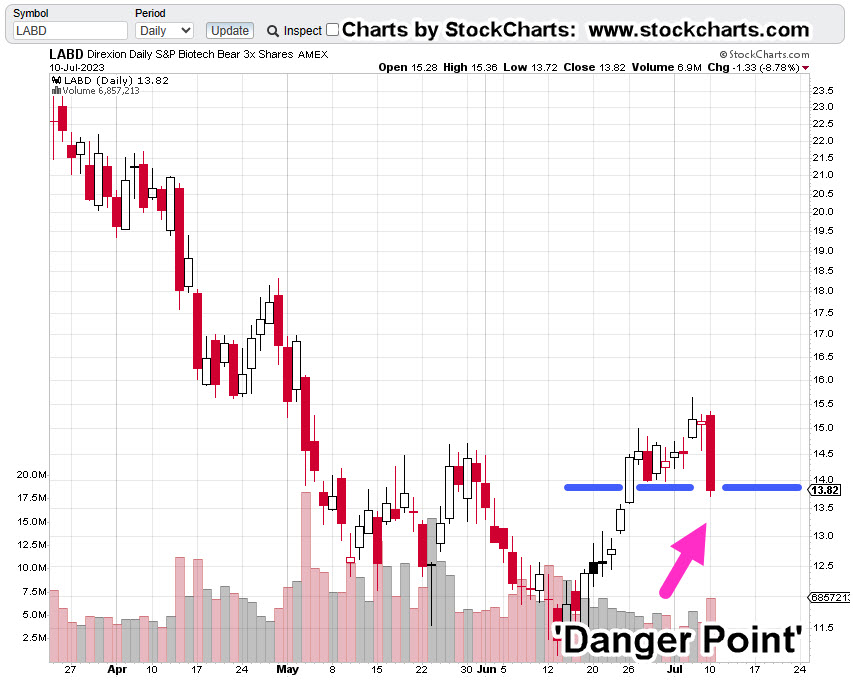
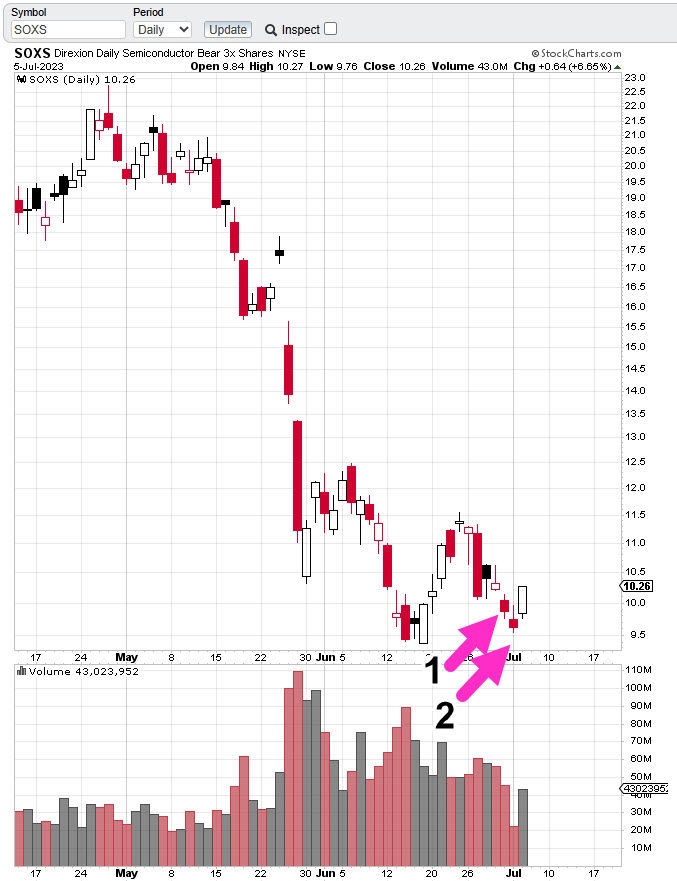
With that, let’s go to the leveraged inverse fund SOXS.

Semiconductors, Leveraged Inverse SOXS, Daily

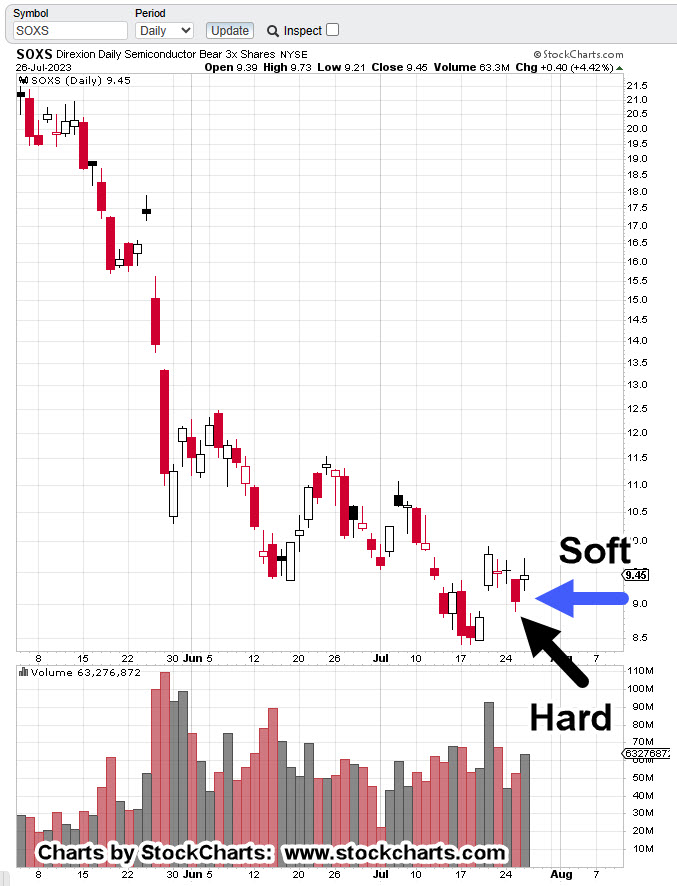
The chart is self-explanatory.

Hard Stop (definite exit) at the prior session low of SOXS 8.89. Soft Stop (trader discretion) at today’s session low of SOXS 9.21 (not advice, not a recommendation).

Next up, and depending on price action, we’ll discuss a potential trading channel.

Stay Tuned

Charts by StockCharts

Note:  Posts on this site are for education purposes only.  They provide one firm’s insight on the markets.  Not investment advice.  See additional disclaimer here.

The Danger Point®, trade mark: No. 6,505,279

‘Throttle Whack!’ … SOXX

Short Seller, Shake-Out

Just in case someone’s not seen what a ‘whack’ looks like, here it is.

Notice, the kid on the left seems to be saying ‘It’s not that bad’ … oh, really? 🙂

A few seconds later we get to The Whack. The kids run off and the ‘old timer’ comes in to take their place, with his ear protection and respirator.

A perfect analogy for the markets.

SOXX, To New Highs, or Last Gasp?

If the bulls are going to regain control, this would be the place. If they can’t hold on, then it’s likely we’ve past the top last Tuesday, the 18th.

Depending on how the market closes the session (currently, 11:35 a.m., EST), the stop on the short position (via SOXS) may be moved higher (not advice, not a recommendation).

Ideally, we need to have a new daily low on the SOXX (high on the SOXS) to move the stop.

Stay Tuned

Charts by StockCharts

Note:  Posts on this site are for education purposes only.  They provide one firm’s insight on the markets.  Not investment advice.  See additional disclaimer here.

The Danger Point®, trade mark: No. 6,505,279

All The King’s Horses …

And All The King’s Men …

Could Not Put The ‘AI’ Hype, Back Together Again

Over the weekend it’s been non-stop Artificial Intelligence (AI) hype.

Even now, as of this post, it continues with links like this one, this one, this one and on and on.

Despite all that, a funny thing is happening in the market.

The SOXX, is not moving higher.

This mass psychosis could be the largest public fleecing set-up, ever, in market history.

But wait, there’s even a more insidious twist.

As reported by The Maverick, link here (Time Stamp 10:45), the AI bandwagon is being hijacked by certain ‘entities’.

With that, the herd mentality can cause insane results.

So, one has to always be willing to exit a position if the unexpected shows up (not advice, not a recommendation).

Semiconductor SOXX, Daily

As of this post (11:37 a.m., EST), the SOXX is in a kind of ‘no man’s land’.

So far today, it has not made a new daily high or low.

Tight price action typically precedes a breakout whether it’s up or down.

Let’s see what happens next.

Stay Tuned

Charts by StockCharts

Note:  Posts on this site are for education purposes only.  They provide one firm’s insight on the markets.  Not investment advice.  See additional disclaimer here.

The Danger Point®, trade mark: No. 6,505,279

It’s Lonely At The Top

The ‘AI’ Top

We’re about to find out if last Tuesday, was the top in AI, or just another interim top on the way higher.

No matter the Taiwan Semi slow-down, mainstream media’s not even considering we’re near (or past) a potential long-term reversal.

For this update, the SOXX is being used as proxy for the AI mania. The chief cook and bottle washer in this latest delusion is Nvidia (NVDA), which reached a high on Friday, July 14th.

Basic Indicators, Wyckoff & The Cat

Even without using Wyckoff analysis, basic indicators like MACD, both on daily and weekly are telling us the momentum has slowed; on the daily, it’s outright reversed to the downside.

From a Wyckoff standpoint, we’ve had an up-thrust (reversal) that’s been supported by decreasing up-volume and increasing down-volume (shown on daily, below).

The cat’s out of the bag with Taiwan’s earnings release.

What we have are delays, more delays, coupled with revenue slowdowns (not advice, not a recommendation).

So, NVDA, where’s the money? Where’s that $11-Billion?

Slow, At-First?

If we’re past the top, it could be slow at first. Maybe imperceptible that a significant reversal is at hand.

If that’s the case, it might all change on August 23rd, when NVDA releases its own earnings.

Semiconductors, SOXX, Daily

The daily chart shows we’re holding below resistance (blue line) after an apparent reversal.

The probabilities are accumulating that we’re in some kind of sustainable reversal.

Next week is likely to show us if that assessment is correct (not advice, not a recommendation).

Positioning

Stated previously, this site does not provide advice.

With that said, here’s how it looks on the company’s spreadsheet for shorting the SOXX using leveraged inverse fund SOXS.

Next week’s action is likely to either force an exit of the position or allow for the trailing stop to be increased.

Stay Tuned

Charts by StockCharts

Note:  Posts on this site are for education purposes only.  They provide one firm’s insight on the markets.  Not investment advice.  See additional disclaimer here.

The Danger Point®, trade mark: No. 6,505,279

AI, ‘Train-Wreck’, Leaves Station

Did You See The ‘Elephant’ ?

It’s hidden in plain sight.

Taiwan Semi (TSM) releases lackluster results, revenue slowdown and new building construction delays.

TSM says the delays stem from the inability to find qualified workers.

Edward Dowd provides insight on the overall reduction of employees, in this interview (Time stamp 5:10).

Bull Trap Shut, Train Leaving Station

If there ever was a ‘gotcha’ moment, this is it.

Even while the mainstream continues to tout the hype, here, here and here, the market has reversed (not advice, not a recommendation).

The daily chart of SOXX, has the MACD bearish divergence confirmed. Price action is now (as of 3:05 p.m., EST) well below the breakout (blue line) resistance area.

Semiconductor SOXX, Daily

This site does not give advice, but it can be inferred by reading the reports what actions are being executed (not advice, not a recommendation).

With that said, short positions in the SOXX, via leveraged inverse SOXS, were entered early during yesterday’s session at SOXS 8.54 and SOXS 8.69.

As a side note, within minutes after today’s market open, the gain in the SOXS, fully erased the -7.9% loss via LABD, noted in yesterday’s update.

The Biotech ‘Bid’

For whatever reason, probably to be revealed months or years from now, biotech, the instigator of the ‘elephant’ is not selling off into a market collapse as expected.

Instead, the effects are being played out in low-margin industries like airlines and semiconductors.

Stay Tuned

Charts by StockCharts

Note:  Posts on this site are for education purposes only.  They provide one firm’s insight on the markets.  Not investment advice.  See additional disclaimer here.

The Danger Point®, trade mark: No. 6,505,279

The Last of The Bubble(s)

‘Idol’ Worship

If Artificial Intelligence, really is the last of the bubble(s), isn’t it appropriate we culminate in a market top of the ages, with the desire (and delusion) that we can be like God.

Let’s ask ‘AI’ how to get rid of spike protein … see what it says.

We’re around mid-day; the SOXX, is raging a bull/bear battle inside the range of yesterday’s session.

Tuesday’s session was not able to post a new high or low. With that said, the Fibonacci count from the last update remains intact.

Semiconductor SOXX, Daily

The chart shows upside pressure (volume) is dissipating.

As of this post, the MACD (not shown) is flat, waiting to tick lower; not yet confirming the bearish divergence.

A penetration of the prior session low, SOXX 524.11, would give a classical analysis sell signal (not advice, not a recommendation).

Tomorow’s TSM Earnings

Anything can happen.

SOXX, could spike higher to the previously identified 550- 560, area.

Or, we could have an immediate ‘sell the news’ event.

Either way, it’s up to the speculator/trader to decide for himself whether to take action, or not.

Biotech Short

Separately, the biotech short via LABD, has been exited with a – 7.9%, loss. So, there’s that.

On to the next trade (not advice, not a recommendation).

Stay Tuned

Charts by StockCharts

Note:  Posts on this site are for education purposes only.  They provide one firm’s insight on the markets.  Not investment advice.  See additional disclaimer here.

The Danger Point®, trade mark: No. 6,505,279

There’s A ‘Hole’ In The SOXX

Count of The Fibonacci

While the media’s wasting no time setting up the average investor, for a ‘guaranteed skinning’ (as Dr. Elder used to say), providing an environment of constant, incessant, AI ‘get-in-now’, buy recommendations.

With that said, an ominous market sign has appeared.

As the daily chart of SOXX shows, we either have a breakout or a hole that’s about to be filled (reversed).

Semiconductor Index SOXX, Daily

In technical terms, the SOXX is in Wyckoff ‘Up-Thrust’, reversal position (not advice, not a recommendation).

A tick lower in MACD, confirms the bearish divergence.

Then, there’s Fibonacci

Enter, The Count

When markets are in a mania, reaching insane extremes, it allows for a (more) clean print of either Fibonacci retrace levels or time correlation.

Decide for yourself if that’s the case now.

Remember, tomorrow (Wednesday) is the 19th, and one day before Taiwan (TSM) releases earnings.

That release is scheduled for the 20th before the open.

Stay Tuned

Charts by StockCharts

Note:  Posts on this site are for education purposes only.  They provide one firm’s insight on the markets.  Not investment advice.  See additional disclaimer here.

The Danger Point®, trade mark: No. 6,505,279

SOXX … The ‘AI’ Wedge Higher

Last Gasp Before August 23rd?

The SOXX chart pattern (below), is telling us we’re likely in a case of …’buy the rumor, sell the news’.

Yesterday’s action may have negated any immediate reversal downward.

Now, it looks like we’re going into a terminating wedge targeting SOXX higher to approximately 550 – 560 (not advice, not a recommendation).

Of course, anything can happen.

Semiconductor SOXX, Daily

Note, the potential for a bearish MACD divergence if SOXX moves to new highs.

If we thought there was hysteria now, just think what’s it’s going to be like if SOXX breaks to the upside.

Party, like it’s 1999

Then, Biotech SPBIO

Meanwhile back at the ranch, with about a half-hour to go before the regular session, biotech leveraged inverse LABD, is hovering at yesterday’s lows.

Biotech SPBIO, Leveraged Inverse LABD, Daily

Support (blue line) has been penetrated.

Price action has stopped dead … thus far.

This sector has been the downside leader (LABD, higher) in the past so, we’ll see if that’s happening now.

The ‘Life Insurance’ Correlation

There appears to be correlation with potential downside reversal in biotech and possible downside reversal in the life-insurance sector.

We’ll discuss that in another update.

Stay Tuned

Charts by StockCharts

Note:  Posts on this site are for education purposes only.  They provide one firm’s insight on the markets.  Not investment advice.  See additional disclaimer here.

The Danger Point®, trade mark: No. 6,505,279

ChatGPT, Tops-Out

And With That, It’s Over

The ChatGPT craze lasted just long enough to ramp Nvidia and the SOXX, to stratospheric levels.

In the coming weeks and months, we’re likely to see who ‘cashed-in’ (a la Elon Musk) and for how much.

When a bull market nears the end of its lifecycle, it tends to thin-out.

As the smaller cap stocks fall away and underperform, they’re sold and that capital’s funneled into the ‘last man standing’; in this case, Nvidia (NVDA).

Broadcom (AVGO) is there as well, but it’s a distant second at 1/3rd, the market cap of NVDA.

Short Positioning

We’re short this sector via SOXS (not advice, not a recommendation) with entries shown in the prior update.

There was a third entry on 7/6 (not shown), but it’s minimal size when compared to the others.

Now, on to the charts

Semiconductor Leveraged Inverse Fund, SOXS

The following chart has the current hard-stop progression and soft-stop (trader discretion) locations.

Moving in closer with the zoom version.

The ‘AI’ bulls are in their brain stem (un-thinking), enabled in their fantasy by articles like this one and this one.

Of course, there’s more like here and here but we get the picture.

Taiwan Semi (TSM) Earnings Date

At the time of this update, TSM earnings date was an estimate, now confirmed as July 20th, before the open.

It’s about to get interesting.

Stay Tuned

Charts by StockCharts

Note:  Posts on this site are for education purposes only.  They provide one firm’s insight on the markets.  Not investment advice.  See additional disclaimer here.

The Danger Point®, trade mark: No. 6,505,279

Managing The (SOXS) Trade

The ‘AI’ Reversal

It looks a little unstable for the ‘AI’ bulls.

The top in the SOXX, was correctly identified, here.

The potential completion of the downside test and reversal was discussed, here.

After that last post, the SOXX limped higher for one day, before reversing, today.

In fact, today’s session lows took out the daily lows of the prior two sessions.

This update will be brief.

A short position (via SOXS) was initiated on Friday June 30th, then increased by 20%, this past Monday, July 3rd (not advice, not a recommendation).

Semiconductor Leveraged Inverse Fund SOXS, Daily

Entries are shown as Arrow No. 1 and No. 2

An original soft stop (trader discretion) and hard stop were given of 9.75, and 9.48, respectively.

Price action on Monday pushed through the soft stop and trader discretion was to maintain the position.

As a result of today’s action, the hard stop has been moved up to SOXS 9.54, with a soft stop at today’s SOXS low of 9.76 (not advice, not a recommendation).

Stay Tuned

Charts by StockCharts

Note:  Posts on this site are for education purposes only.  They provide one firm’s insight on the markets.  Not investment advice.  See additional disclaimer here.

The Danger Point®, trade mark: No. 6,505,279