It’s An Industrial (economic) Metal

Things just aren’t working out for the silver bulls.
The metal is down yet another 1% in today’s session.
Not only that as we’ll see below, but we could also be in a downward trading channel as well.
Talk about a ‘hyperinflation breakout’ has all but disappeared and we’re back to the (very lame, by now) excuse that it’s all because of those evil ‘manipulators’.
Leaving delusion behind, back to reality, price action itself, this site’s been consistent for over five months.
That is, silver’s exhibiting characteristics of a downside reversal or sideways congestion (not advice, not a recommendation).
Silver SLV, Daily
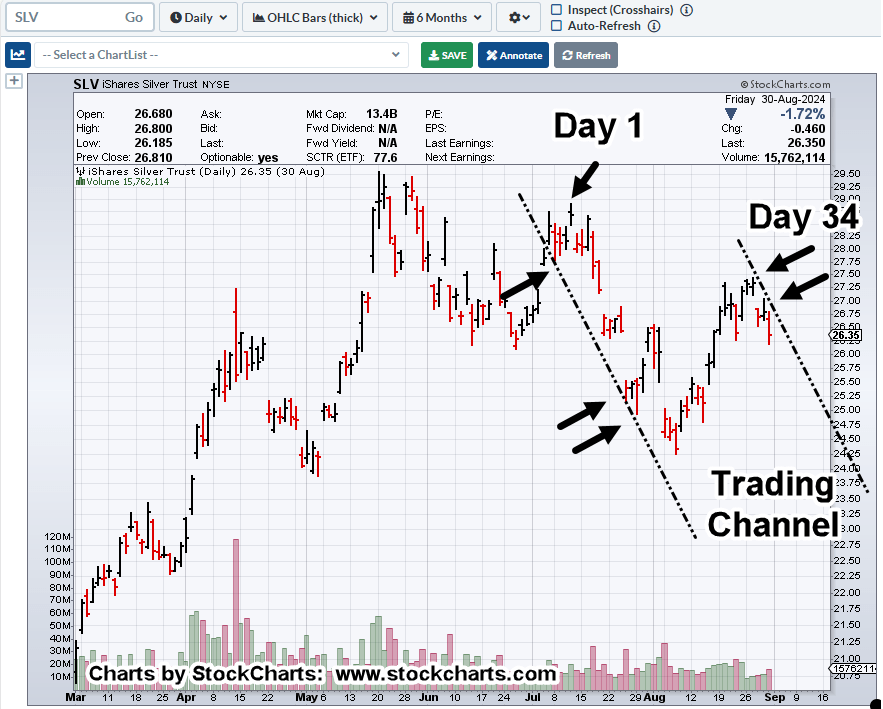
From the chart above, we can see the right-side being confirmed over the past four or five sessions (black arrow contact points).
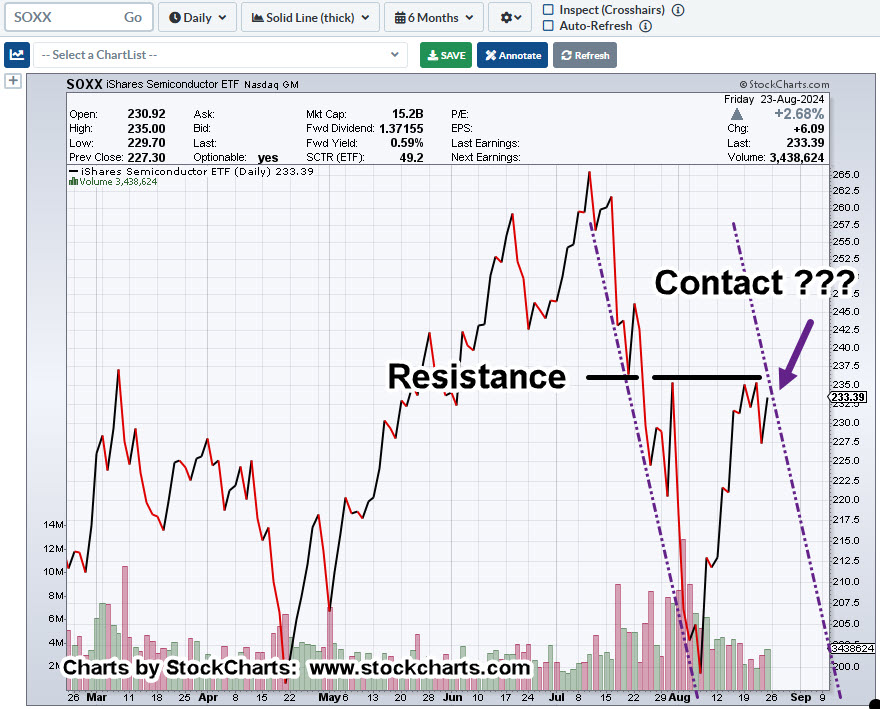
Also noted, there’s a Fibonacci time correlation between the intermediate high on July 11th and the right-side channel line contact on August 27th.
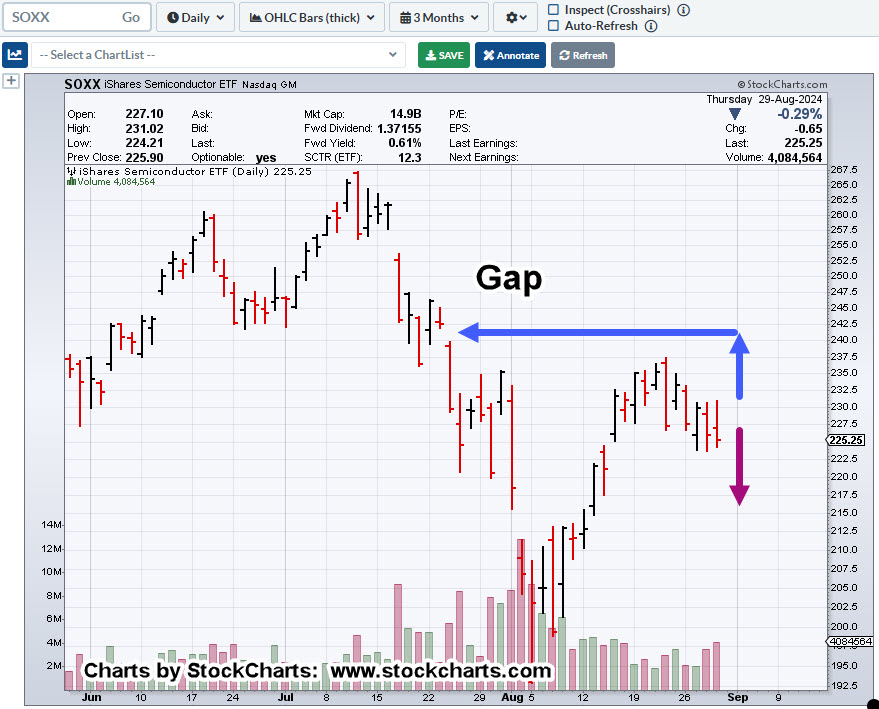
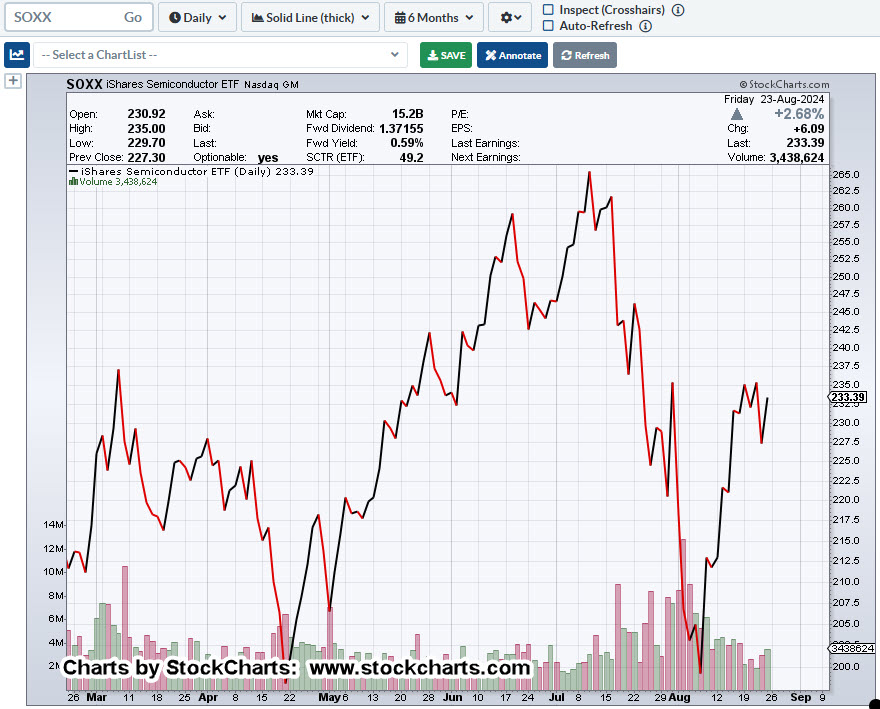
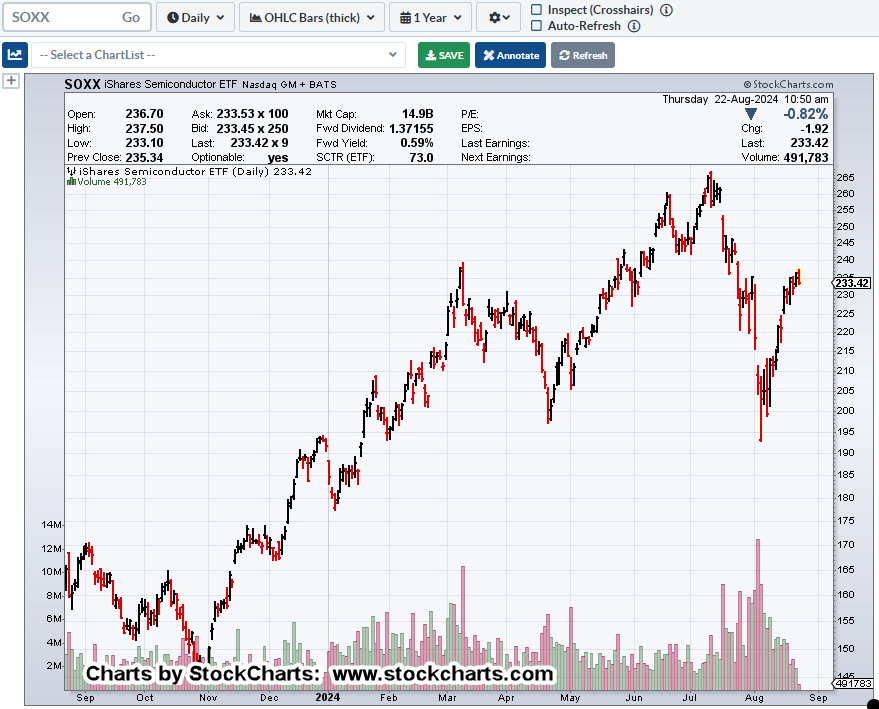
July 11th, was also the SOXX top.
About two decades ago, Prechter first proposed, ‘It’s all the same market’; meaning, that it’s the liquidity in the system that’s moving prices.
As that ‘liquidity’ dries up with more demand for cash (fiat, or not), the expectation is for the market indices to respond to that demand (not advice, not a recommendation).
Stay Tuned
Charts by StockCharts
Note: Posts on this site are for education purposes only. They provide one firm’s insight on the markets. Not investment advice. See additional disclaimer here.
The Danger Point®, trade mark: No. 6,505,279