‘We Need A New Story’

The mainstream has run out of hype; at least for now.
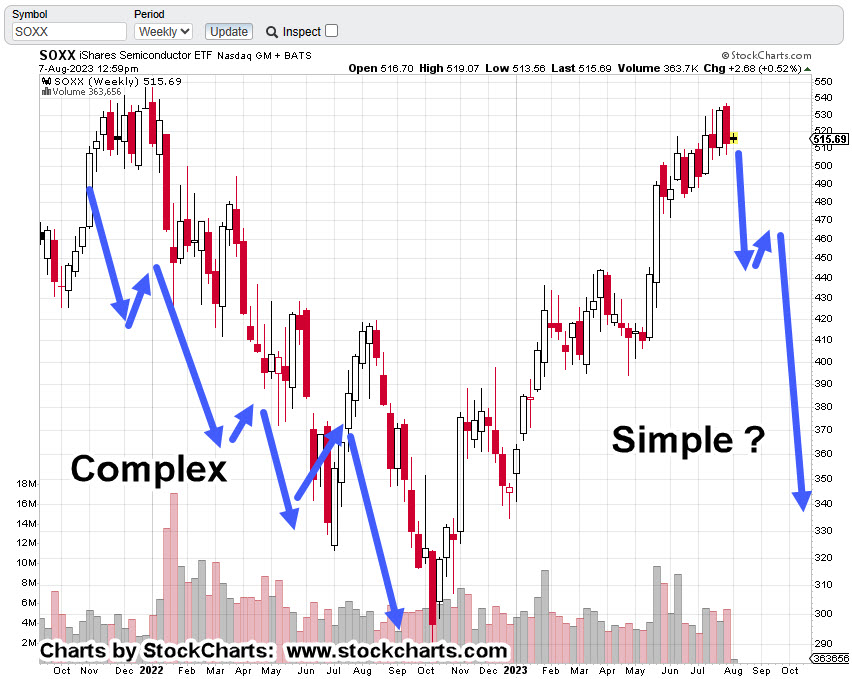
Their AI mania narrative and price action blew up yesterday.
The probability for a blow-up was identified ahead of time, here.
Who knows how many retail investors bought in, now, left holding the bag.
The more probable (overall market) outcome at this point, is sustained, persistent, downside … possibly for years if not decades (not advice, not a recommendation).
However, not every market is going to go straight down. Some, might actually go higher.
Natural Gas & The ‘Disruption’ Trade
One of those upside probabilities highlighted in this update was Nat-Gas.
From that update we have:
“If UNG, heads lower yet again, it could be the last straw for the weak bulls, causing them to close out.”
Nine trading days later, that’s exactly what happened.
The original chart of UNG, has been updated to show subsequent price action.
Natural Gas UNG, Daily

When price action penetrated support (lower blue line), it puts UNG at The Danger Point®
This is where the risk of being wrong for a long position is least (not advice, not a recommendation).
Positioning
Taking the above into account, with downside risk potentially minimized, two entries were made during this session (currently, 1:21 p.m., EST).
One at UNG 6.64, and another larger entry at UNG 6.75.
An obvious Hard Stop is yesterday’s low of UNG 6.49, with a Soft Stop (trader discretion) at today’s low of UNG 6.63 (not advice, not a recommendation).
Stay Tuned
Charts by StockCharts
Note: Posts on this site are for education purposes only. They provide one firm’s insight on the markets. Not investment advice. See additional disclaimer here.
The Danger Point®, trade mark: No. 6,505,279