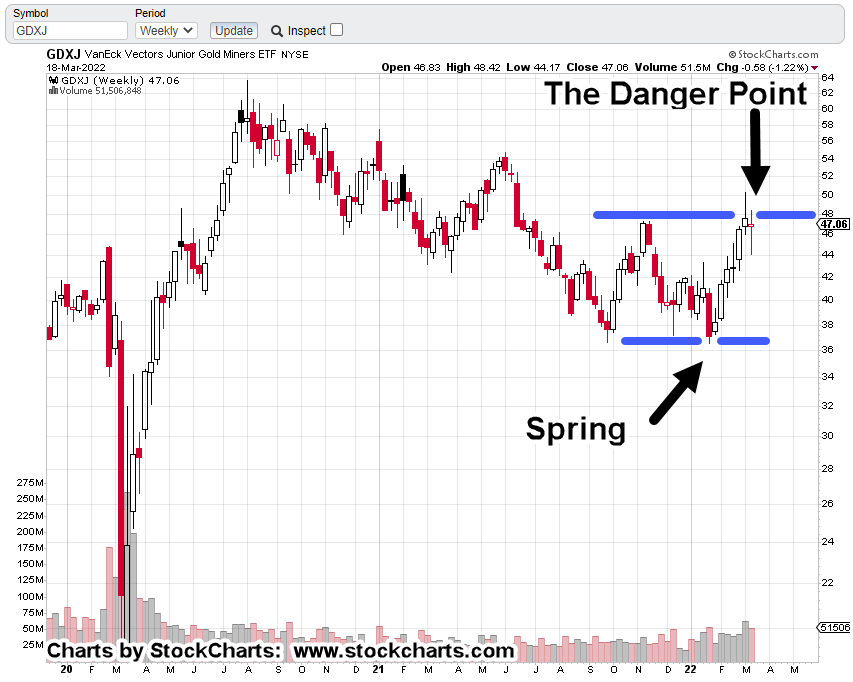
Emerging Markets, Bounce Top ?

At The Danger Point

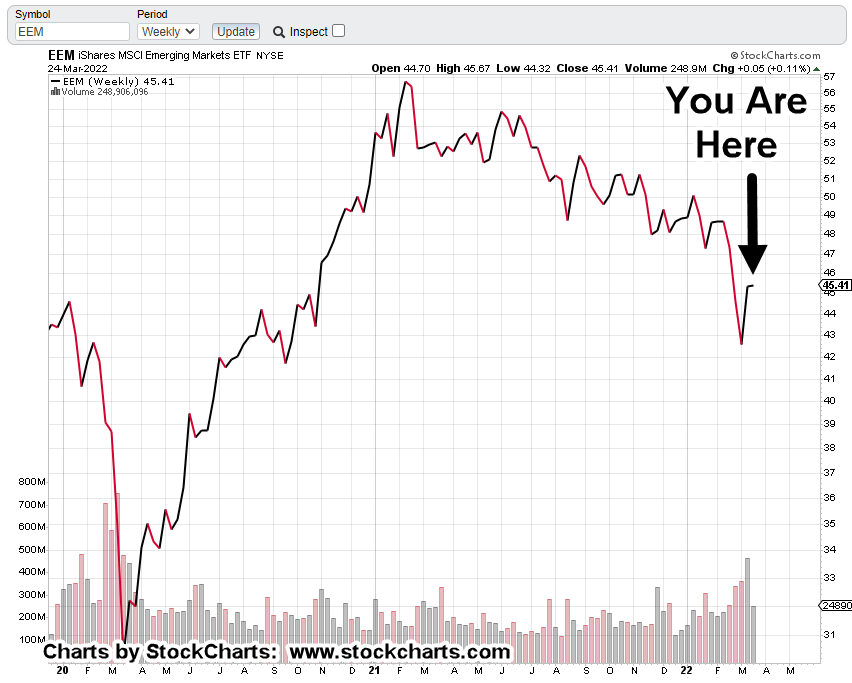
Emerging Markets (EEM) price action has stopped dead.

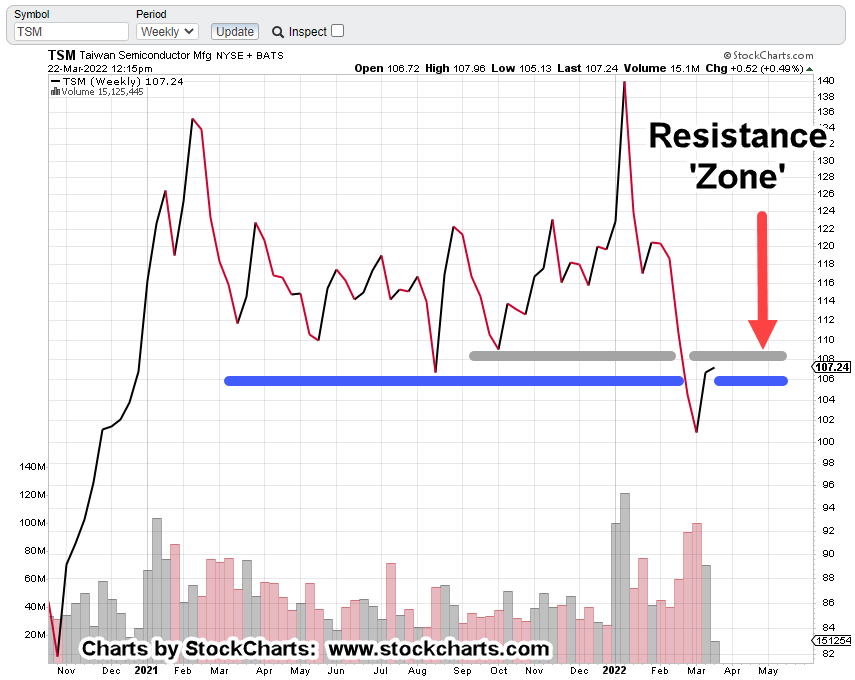
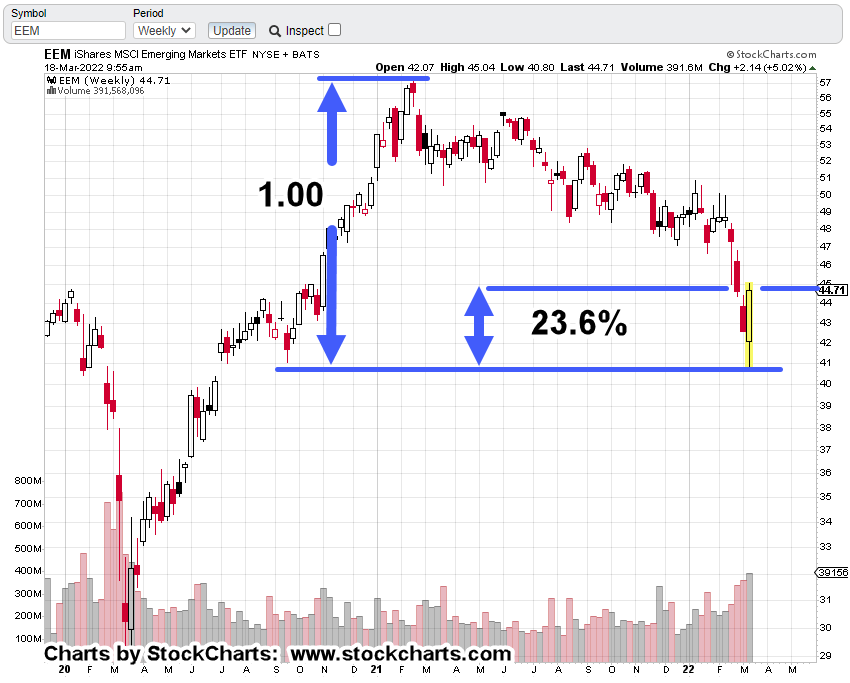
As we’ll see below on the Weekly Close chart of EEM, there was a huge run-up last week.

This week’s different as the upward move has (at this juncture), come to a halt.

Emerging Market, EEM Weekly Close

It may be tongue-in-cheek, but the arrow shows that so far, there’s been essentially no upward progress this week.

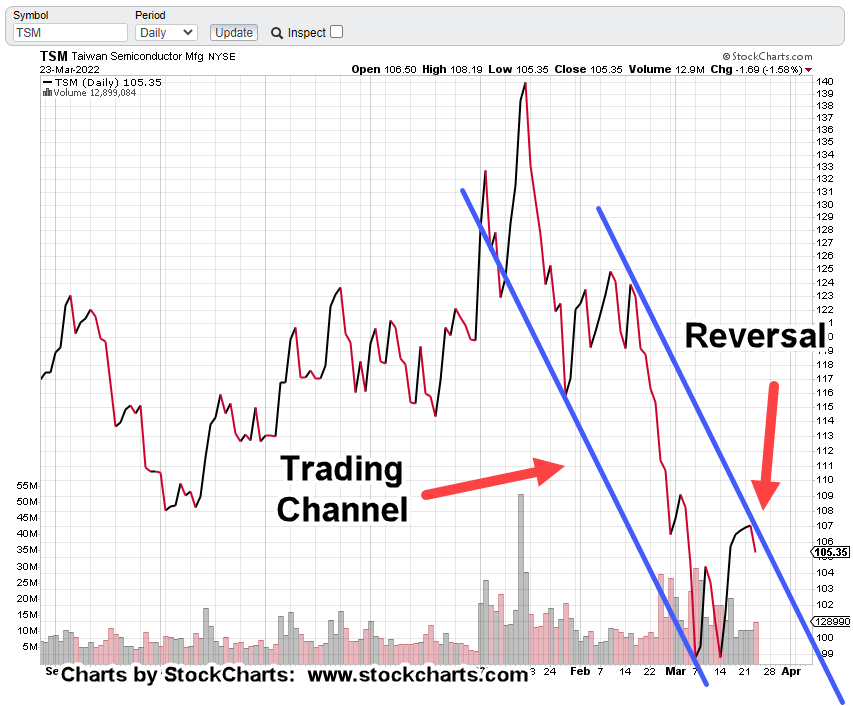
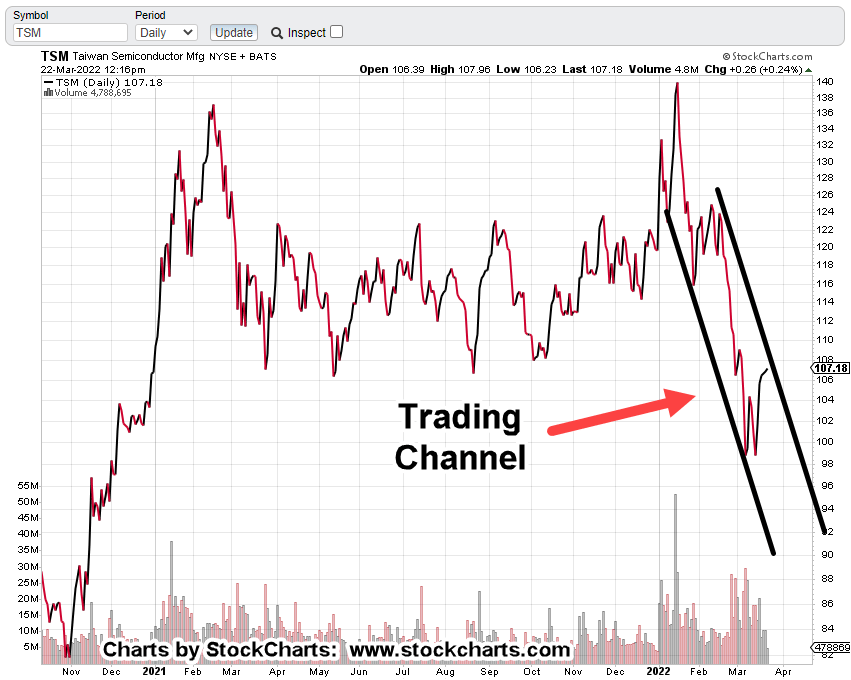
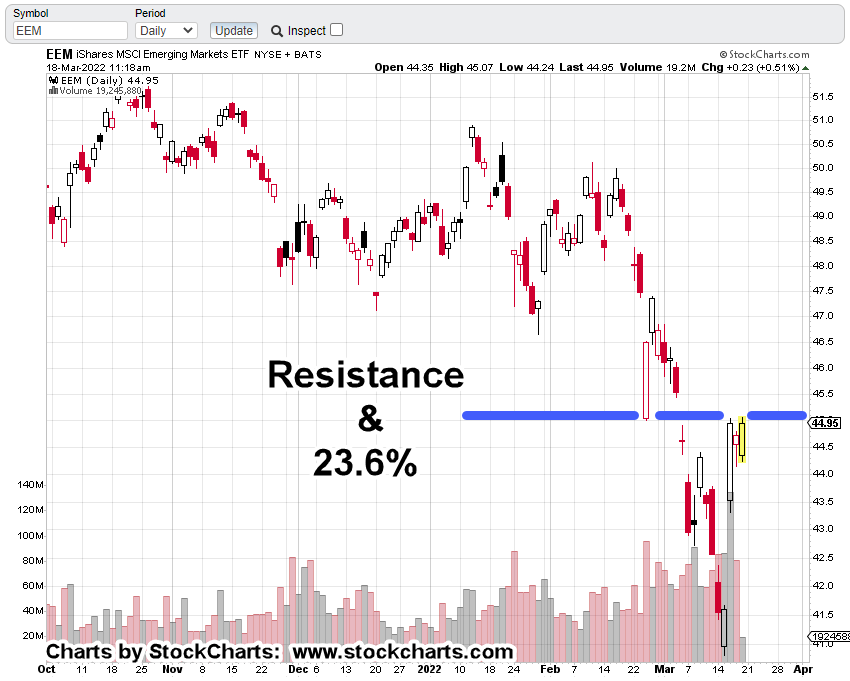
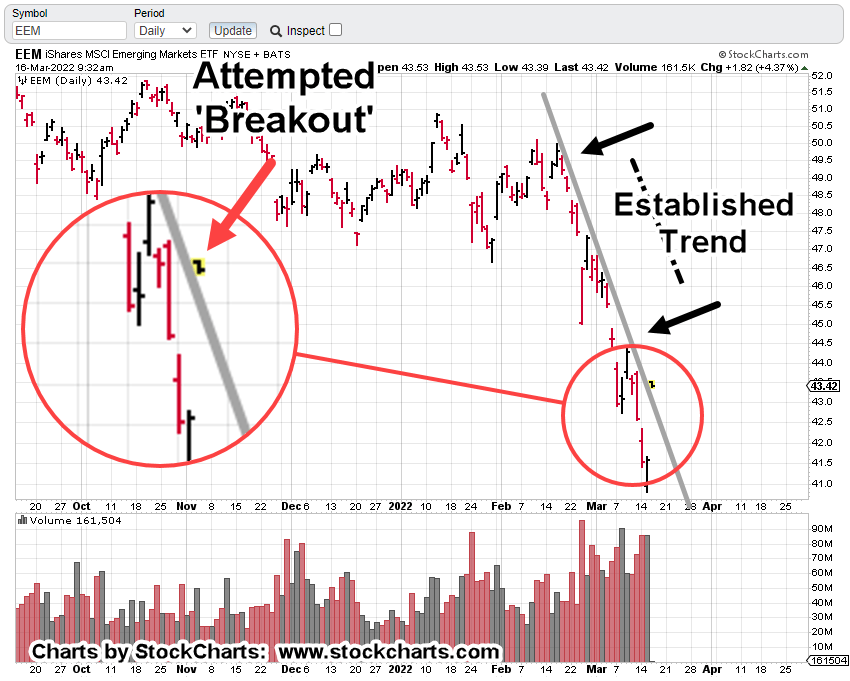
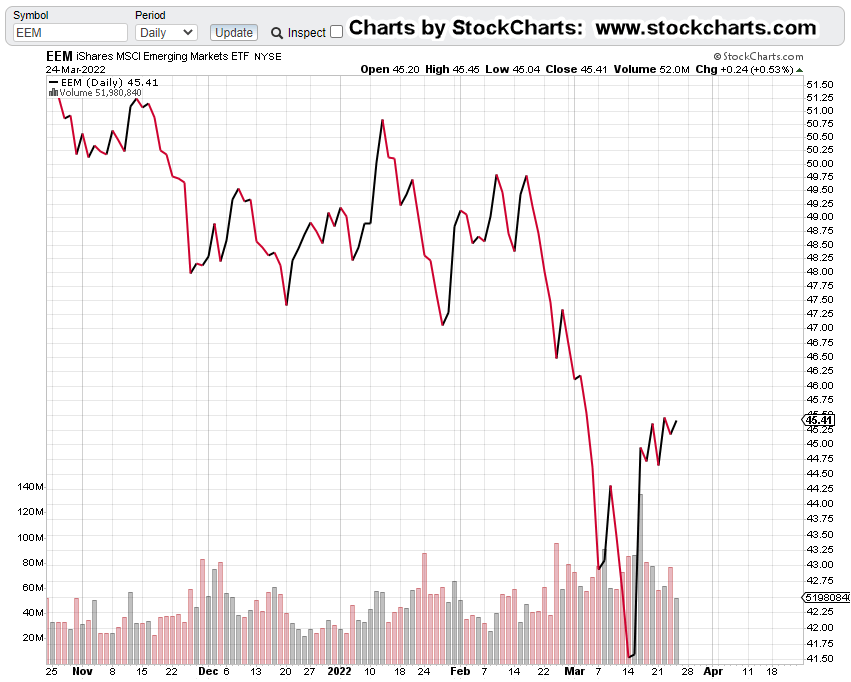
Looking at the un-marked daily close, we have this.

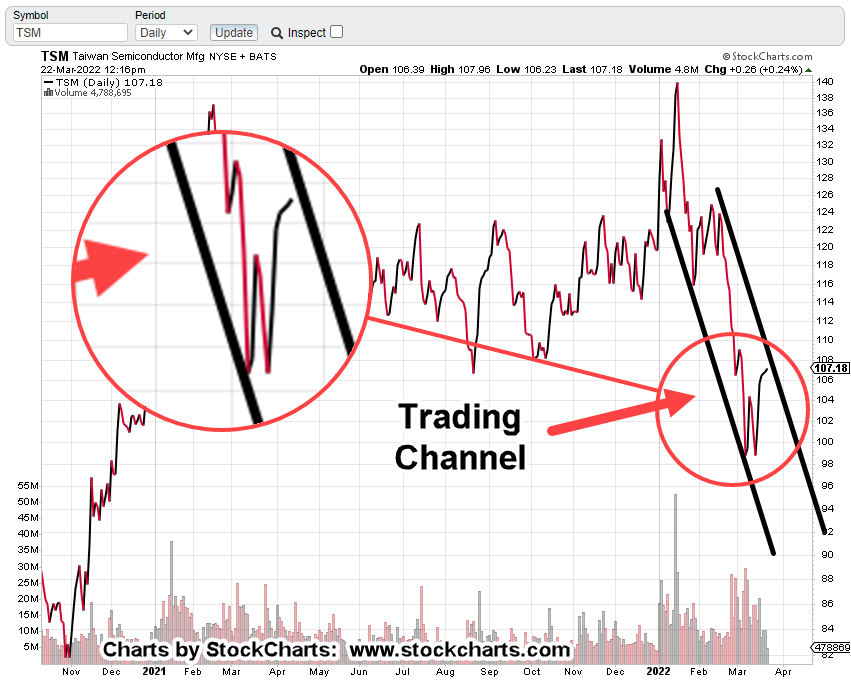
Expanding the last several trading sessions, the upward net moves have become shorter.

Today, price action failed to close at a new (bounce) high.

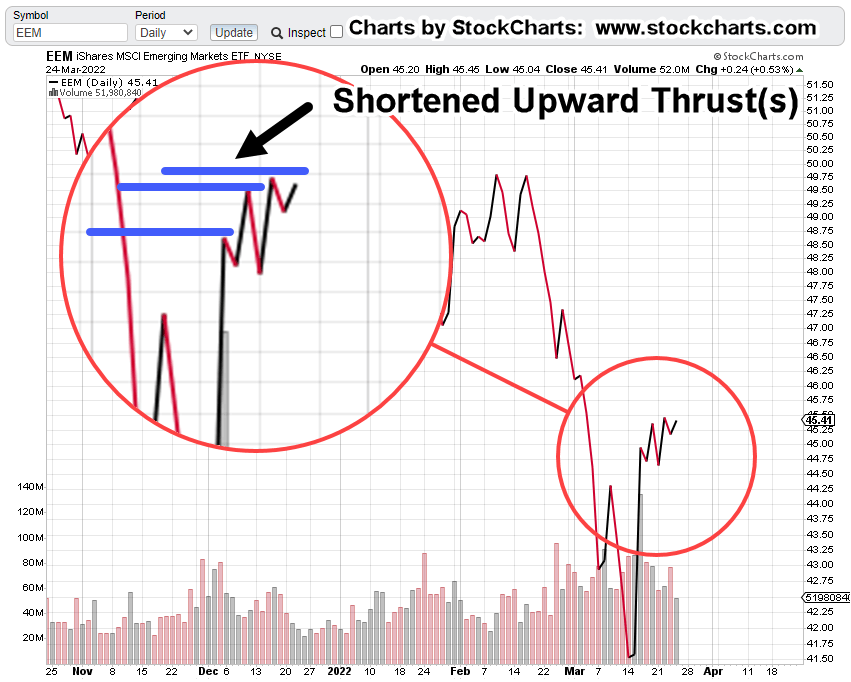
Volume also contracted -32.5%, from the previous session and gives clues we may be at or near a top.

Summary

If EEM’s price action is slowing down on the upside, then leveraged inverse EDZ, is slowing down on the downside.

Compared to last week, this week has been very quiet.

As said in other posts, a 23.6% retrace is rare.

However, if EEM reverses from this point, confirming the top, then downside opportunity is likely to be significant (not advice, not a recommendation).

Stay Tuned

Charts by StockCharts

Note:  Posts on this site are for education purposes only.  They provide one firm’s insight on the markets.  Not investment advice.  See additional disclaimer here.

The Danger Point®, trade mark: No. 6,505,279

Taiwan Semi … Reverses

The Market Leads The News

Price action leads the news, not the other way around.

The last update on TSM had this:

“A reversal away from this area confirms the channel and weights probability to more downside …”

As seen in the chart of TSM, a reversal is what we’ve got.

TSM, Daily Close

Note that volume increased on the reversal; helping to confirm the channel.

If this reversal ‘sticks’ and TSM continues lower, the downside potential is significant.

Summary

It’s a no-brainer to assess the world situation as unstable.

It’s exactly during these (once in several generation) events where international borders (for example) like Taiwan and China could potentially change.

Several links of interest on China/Taiwan are below.

China ‘There by tomorrow

Tencent shares plunge

Hong Kong … mandatory tests

China mandates ‘zero policy

China lockdowns to disrupt supply chains

What could go wrong ?

As Livermore said nearly a century ago … ‘surprises tend to happen in the direction of trend’.

Stay Tuned

Charts by StockCharts

Note:  Posts on this site are for education purposes only.  They provide one firm’s insight on the markets.  Not investment advice.  See additional disclaimer here.

The Danger Point®, trade mark: No. 6,505,279

Taiwan Semi … At Resistance

Testing The Underside

Trading Channel

Weekly Close, TSM

Starting with the weekly close of TSM below, we can see the recent top, breakdown and now test.

Closer-in on the next chart, the market’s testing resistance.

Looking at the daily close, it gets more intriguing.

Daily Close, TSM

Looks like TSM’s at the right edge of a downward channel.

Zoom-in

A reversal away from this area confirms the channel and weights probability to more downside (not advice, not a recommendation).

Summary

Taiwan Semi (TSM) is the largest cap in the Emerging Markets, EEM.

Leveraged inverse of the fund is EDZ.

If we get a reversal in TSM this session or possibly next, it may affect the overall emerging markets sector, dragging the EEM down as well.

Unless the tone changes (U.S. and world), meaning that volatility would have to subside, price action behavior at this juncture, suggests it’s a bear market.

Stay Tuned

Charts by StockCharts

Note:  Posts on this site are for education purposes only.  They provide one firm’s insight on the markets.  Not investment advice.  See additional disclaimer here.

The Danger Point®, trade mark: No. 6,505,279

From Gold … To Crypto

Herding Towards The ‘Beast’

Are assets flowing out of gold, into Crypto?

Time stamp 9:27, at this link, Kyle Bass gives his perspective on why the precious metals (along with equities) have not launched higher.

‘People moved to other assets’

Insanity seems to be the go-forward behavior of what’s happening world-wide and in the markets.

Who knows how long the delusion(s) will last?

All it might take, is one major ‘Carrington Event‘, Coronal Mass Ejection to rip the mask off Crypto; just as this link has done with the truth of ‘The Speck’ protection.

From a predictive programming standpoint, it’s interesting the typical symbol for crypto, the most popular ‘Bitcoin’, is colored gold.

Which brings us to the actual chart of gold (GLD).

Gold (GLD) Weekly

From a Wyckoff, tape-reading approach, we have to trust what the chart is telling us.

That is, gold has reversed.

Earlier posts on gold and the miners have effectively stated, there’s no more ‘fear’ to be had save an outright nuclear detonation.

If that happens, it’s doubtful that anyone will be running to the gold market for protection.

Does everyone have Potassium Iodide tablets? If there’s an ‘event’, they’ll be worth their weight in gold (literally).

The Noose Tightens

Constriction, elimination of the food supply (along with everything else) continues and is accelerating.

Fortunately, or unfortunately depending on perspective, we’re watching a potential major opportunity unfold.

That is, the opportunity to acquire hard precious assets when (nearly) everyone else liquidates.

Gold to Crypto

Is that even possible?

Would gold (and miners) be sold off to buy Crypto?

According to Kyle Bass in the link above, it’s already happening and has been for a while.

From a ‘beast system’ standpoint, it makes perfect sense, going from the pure (i.e., gold) to man-made, corrupt.

Junior Miners, GDXJ

The last post showed GDXJ, at the danger point.

This (juniors) sector seems to be the most sensitive to metals fluctuations. So, we can use it as a leveraged proxy for the overall market.

One has to wonder what kind of ruse will be created to have the masses dump their precious metals ‘stack’ and panic into crypto.

Stay Tuned

Charts by StockCharts

Note:  Posts on this site are for education purposes only.  They provide one firm’s insight on the markets.  Not investment advice.  See additional disclaimer here.

The Danger Point®, trade mark: No. 6,505,279

Gold Up … Miners Down

It’s Not A ‘Miners’ Bull Market

Gold (GLD) is hovering near all-time highs but the miners, especially the Juniors GDXJ, are far below.

What better way to show the disconnect than looking at the weekly close charts for both gold (GLD), and GDXJ.

GLD & GDXJ, Combined, Weekly Close

The next chart has been discussed in prior updates but is repeated here for refrence.

The difference is GDXJ’s, now in up-thrust (potential reversal) position.

Junior Miners GDXJ, Weekly Close

Closer in on the weekly candle chart, we have the following repeating pattern, ‘Spring to Up-Thrust‘:

We’re at the danger point where it won’t take much to see if action is to continue higher or reverse.

The case for reversal is shown on the daily below.

Note the energy of the upward thrusts Force Index, is dissipating (black arrow) while the energy on the downward thrusts is increasing.

GDXJ, Daily with Force Index

Summary:

The Junior Miners are not in a bull market and have not been for years.

They never fully recovered after gold’s decline during the 2012 – 2015, timeframe. In the meantime, they may have posted an ‘a-b-c’ corrective (bearish) price action.

Obviously, there have been upward spasms as has just occurred over the past six-weeks.

Now, it appears we’re at the juncture where action has set probabilities to favor a downside reversal (not advice, not a recommendation).

Stay Tuned

Charts by StockCharts

Note:  Posts on this site are for education purposes only.  They provide one firm’s insight on the markets.  Not investment advice.  See additional disclaimer here.

The Danger Point®, trade mark: No. 6,505,279

Emerging Markets, Pivot Ready ?

Hovering At Resistance

After Wednesday’s huge run-up, Emerging Markets (EEM) is now hovering at resistance.

Reportedly, there’s a Xi ‘Put’, in place to make sure China and related markets don’t go down.

Never mind that Wednesday’s massive EEM, launch had all the looks of a bear market short squeeze.

From a technical standpoint, several items stand out.

First: Price action’s at support (now resistance) that was determined this past February 24th, on (supposed) news of a Russian invasion.

Second: That resistance level (as shown below) is at a Fibonacci 23.6%, retrace. A 23.6%, retrace that ‘sticks’ is rare; markets tend to go at least to 38.2%, or 50%, before resuming their main trend.

Emerging Markets EEM, Weekly

We’ll start first, with the un-marked weekly chart.

The entire leg lower with 23.6%, retrace.

Now, on to the daily timeframe.

It’s important to note, the first hour of trading, EEM posted a new recovery high just 0.03-pts above Wednesday’s high.

Analysis Tip

The market goes where there are orders.

At this point (mid session), there’re not enough orders for EEM to continue significantly upward.

Summary

Risk may have been reduced for a short position via EDZ (not advice, not a recommendation).

If we get an EEM reversal, the shallow Fibonacci retrace indicates extreme weakness and therefore, downside opportunity is significant.

Stay Tuned

Charts by StockCharts

Note:  Posts on this site are for education purposes only.  They provide one firm’s insight on the markets.  Not investment advice.  See additional disclaimer here.

The Danger Point®, trade mark: No. 6,505,279

Emerging Markets, After Squeeze

Has Risk Been Removed ?

The short answer is yes if you look at the EEM (daily) chart above (not advice, not a recommendation).

If this was a squeeze, and it has all the hallmarks, then price action will begin to erode …. quickly or not.

The good part, now it’s happened, it’s not likely to happen (exactly) this way again.

Prechter’s ‘rule of alternation’, effectively sates that what happened last time, will not happen this time.

Summary

EEM even now, is beginning to pull away from the resistance area.

It could still attempt to test. However, if it was short covering, those (stop) orders have likely been filled.

Stay Tuned

Charts by StockCharts

Note:  Posts on this site are for education purposes only.  They provide one firm’s insight on the markets.  Not investment advice.  See additional disclaimer here.

The Danger Point®, trade mark: No. 6,505,279

Short-Squeeze: Emerging Markets

Bear Market Behavior

Two ways to look at the action.

First: Those late to shorting the Emerging Markets (EEM) are going to get whacked.

Second: Those shorts properly positioned, are going to take a hit but will have an excellent opportunity to move stops after the smoke clears.

Not addressed, are those who think this is an opportunity to go long.

It’s about 25-minutes after the open. The daily chart of EEM, below shows current action.

Emerging Markets, EEM Daily

It’s clear that price action is attempting to break through the trend.

This type of action is typical bear market behavior.

Bear markets are all about price destruction along with an overall downward direction.

The market’s objective is to make sure as many as possible are thrown off the main trend (stopped out, busted out) and not able to participate.

Summary

If the downtrend is still in-effect, EEM price action will stall and then ‘hurry itself’ to get back into the trend … after the shorts have been cleared out.

That short clearing could be just hours or even days.

At this juncture, the current stop for EDZ-22-01, remains at 11.96, as detailed in this post (not advice, not a recommendation).

Update: 10:32 a.m., EST. Position stopped out at 11.96 and posted an overall gain of 8.33%

Stay Tuned

Charts by StockCharts

Note:  Posts on this site are for education purposes only.  They provide one firm’s insight on the markets.  Not investment advice.  See additional disclaimer here.

The Danger Point®, trade mark: No. 6,505,279

Gold Price Action, Blows-Up

Trading The Price … Not The Narrative

The narrative and the price don’t agree; at least at this point.

Over and again, we hear it’s ‘dollar destruction’ and ‘hyperinflation’.

Here is a link to one of the latest pontifications on what ‘inflation’ is doing or is going to do.

After watching that, one is so much better informed. Well, at least we know what the bit-players are saying … each reading from their own (pre-approved) script.

Let’s get back to reality and the price action at hand.

We’ll start with this quote from the last update which references shorting the gold miners using JDST (not advice, not a recommendation).

“However, something that can be done is to use that upward bias to position short at the lowest risk possible.”

That’s exactly what was done during this (past) session; let’s start first with the big picture.

Junior Miners GDXJ, Weekly

As a reminder, and for those who may be new, we’re looking for a particular price pattern that has been shown to repeat over time:

Wyckoff: Spring-to-Up-Thrust

Note in the CAT, example in the link above, price-action up-thrusted and then came right back down to support without any kind of an upward test.

Sometimes, it happens that way.

What’s not known of course, is if GDXJ will respond the same way.

Junior Miners GDXJ, Daily

The chart above is a close-up of the action.

The next chart is leveraged inverse fund JDST. It shows the initial entry of what is labeled trade, JDST-22-02 (not advice, not a recommendation).

Trade entry was just as JDST, price had reached its daily low extreme and was backing off higher (GDXJ, lower); right around 1:14 p.m., EST.

Note the tightness of the stop; just 0.24-points.

Summary

Tomorrow’s action could hit the stop, blow (gap) through the stop or continue upward.

It’s unknown.

What we’ll get for sure, is another data point on what’s really going on with the miners.

Stay Tuned

Charts by StockCharts

Note:  Posts on this site are for education purposes only.  They provide one firm’s insight on the markets.  Not investment advice.  See additional disclaimer here.

The Danger Point®, trade mark: No. 6,505,279

Gold, Way Back To 2009 !

That’s How Far We Have To Go

All the way back to late November 2009, to find a bar that’s remotely similar to the one just posted last week.

Even then, there are key differences.

The reversal during the week of November 30th, 2009 was after a breakout and run-up of about 20%; from the resistance/support area around GLD, @ 100.

Last week’s bar was within a trading range not outside it. Also, we had to wait until this morning’s open to get a new weekly low.

Volume (blow-off) characteristics were similar:

Week-ending 11/30/09, volume 93% higher than the week before; week-ending 3/11/22, volume 43% higher than the week before.

GLD, Weekly Chart

The chart gives us a feel for just how far back we have to go to find similar price action.

The prior update said at this juncture, longer term momentum indicators are pointing higher. Thus, suggesting there will be some kind of upward test either today or this week (Fed meeting?).

Junior Miners GDXJ, Weekly

Earlier this month, this post said to expect GDXJ, to up-thrust in the 48 – 50, area.

That’s exactly where we are now.

GDXJ, back then.

GDXJ, now.

There we have it. The repeating pattern of ‘Spring to Up-thrust’

That does not guarantee a downside reversal. It just shows us price action repeats these behaviors; doing so for decades, if not hundreds of years.

What happens now?

Longer term momentum indicators point higher and give the bias to the upside.

However, something that can be done is to use that upward bias to position short at the lowest risk possible (not advice, not a recommendation).

Positioning via JDST

Junior Miners GDXJ, could come back to test the trendline break shown below starting today, through Wednesday.

If it does, the difference between being correct (about going short) and continued bull side action may be narrowed as much as possible (not advice, not a recommendation).

If that happens, the JDST stop will be very tight.

Stay Tuned

Charts by StockCharts

Note:  Posts on this site are for education purposes only.  They provide one firm’s insight on the markets.  Not investment advice.  See additional disclaimer here.

The Danger Point®, trade mark: No. 6,505,279