Both time cycles and Fibonacci are aligned … targeting intermediate low(s) for the Russell (IWM), in June.
This post, released late on Monday, showed a potential reversal set-up for the IWM.
The next morning (yesterday), saw a sharp, brief move higher which quicky reversed into a sustained decline.
That decline continues during this session.
The weekly chart of IWM is below; marked up with a Fibonacci time sequence.
Russell 2000, IWM, Weekly
Week 34, identified with the back font, represents a 1 : 1, Fibonacci projection of the initial leg down.
Week 34, in the magenta font, is a 1 : 1.618 projection of the same initial move.
These are projections only (not advice, not a recommendation).
However, there’s a time cycle study available at this link.
Go to time stamp 8:27, for the Russell 2000. The method is different, but the projection is similar; heading lower into early Summer (mid to late June).
Note: Posts on this site are for education purposes only. They provide one firm’s insight on the markets. Not investment advice. See additional disclaimer here.
Russell 2000, attempts to break through resistance; reverses and then tests (Monday), just as ZeroHedge says the short squeeze is over.
There’s a lot of trying-to-make-everything-look-complicated, wording in the link above but the take-away is, the market may be finished with the recent short squeeze.
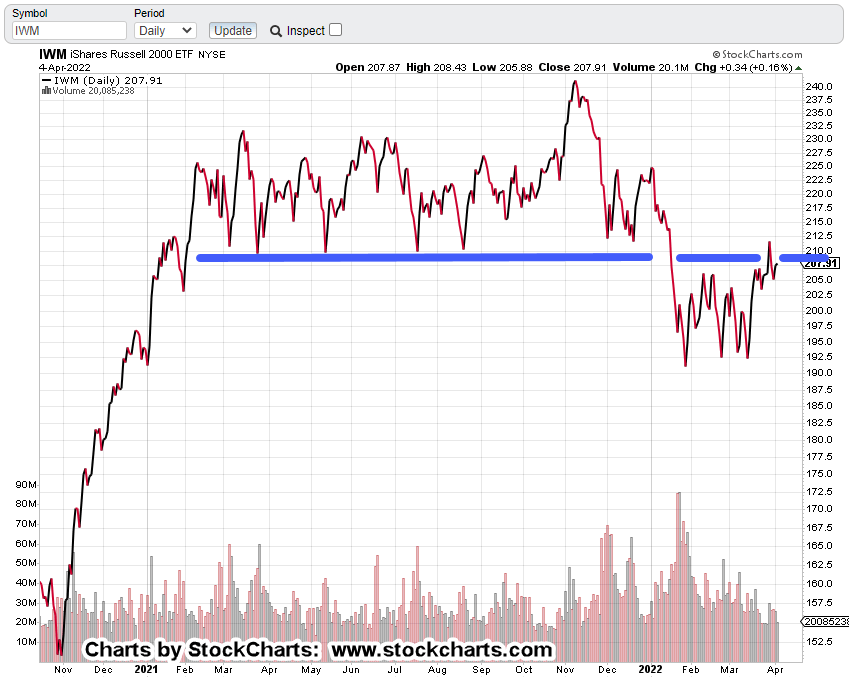
At this juncture, Russell 2000 (IWM) looks like it’s hit long-time resistance around the 211, area and reversed.
The past two trading days may have tested that reversal.
IWM, Daily Close
The support (blue line), now turned resistance has been in-effect for over a year.
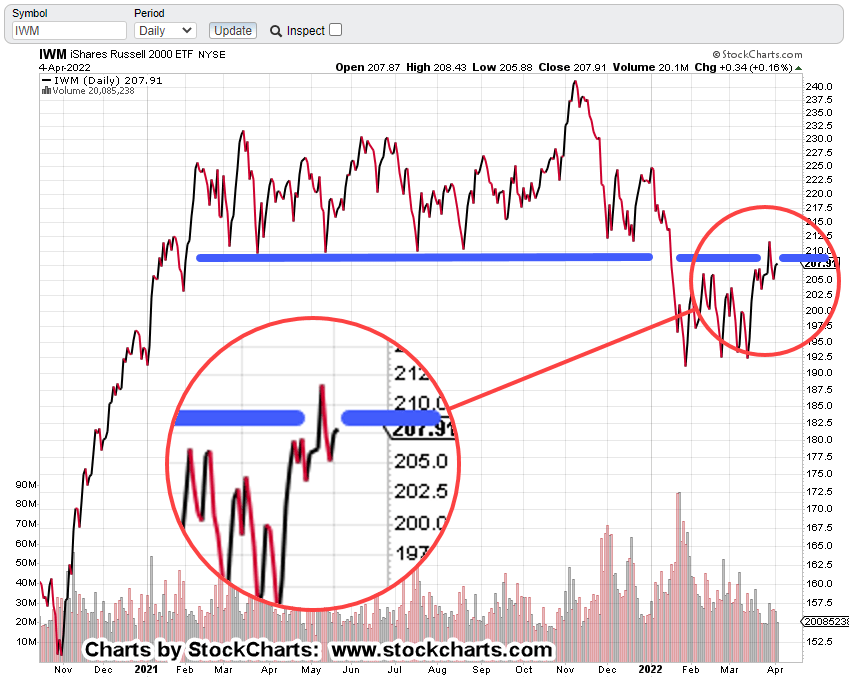
The zoomed version below shows it’s clear, at this juncture, price action’s not penetrating resistance.
As with bonds in this report, we’re at the danger point.
This is where risk is least for either short or long (not advice, not a recommendation).
Naturally, with the ZeroHedge report (above) saying that shorts have been effectively covered, price action direction favors the downside.
Note: Posts on this site are for education purposes only. They provide one firm’s insight on the markets. Not investment advice. See additional disclaimer here.
Bonds are at the danger point; poised for upside reversal.
Upside?
Bonds up, rates down, is that even possible?
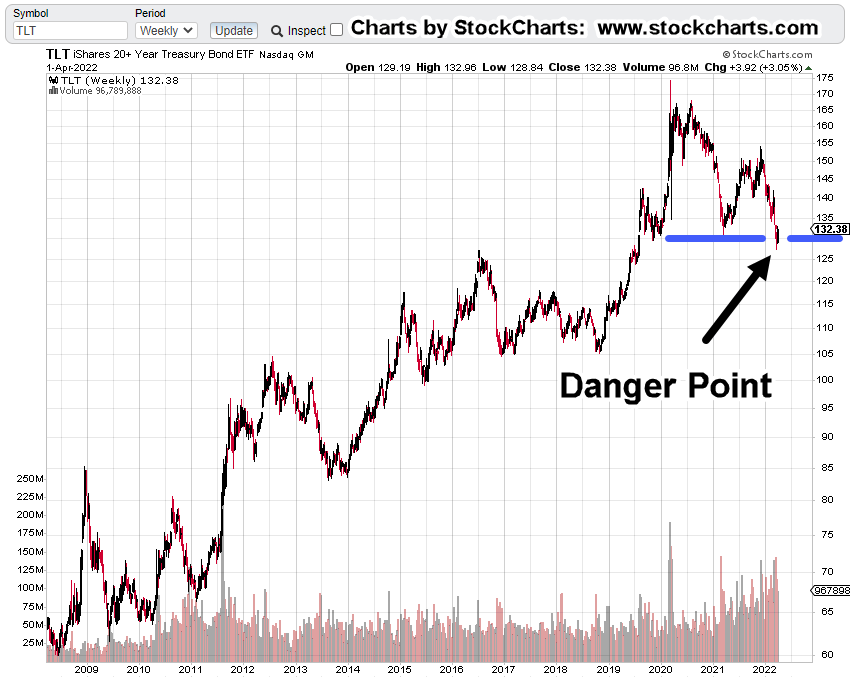
The weekly chart of long bond proxy TLT, is below. It’s not called ‘the danger point’ for nothing.
Weekly, TLT
The danger point is not the top or bottom of a move.
It’s the area where risk is least for either direction. Where the cost of being wrong is reduced as much as possible.
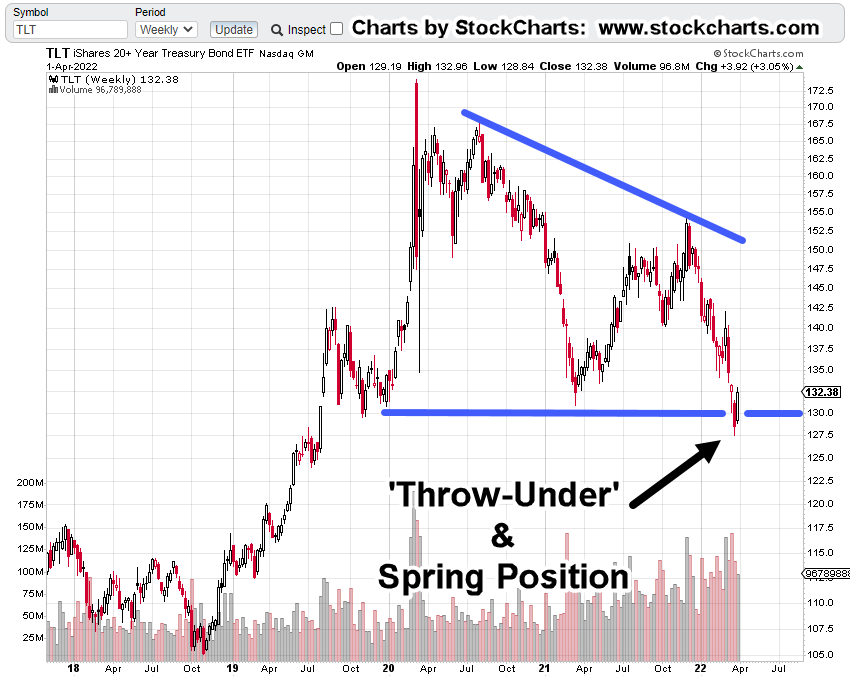
Getting closer-in on the weekly, price action has penetrated support (blue line) and has stopped-dead, so far.
Note the bullish divergence in MACD and MACD lines. It’s not a strong divergence but it’s there.
Next, we have a (bullish) wedge pattern. It’s a big one that took over a year to post.
The False Narrative
If one is serious about their work in the markets, eventually there’s a realization, every narrative is false. The media serves the purpose of the owners and nothing else.
They’re under no obligation to print (or broadcast) anything near the truth, going whole-hog on that ‘freedom’ and fleecing the public at will.
Using that premise, we can say the ‘inflation’ narrative is false or at least twisted; partially true.
The Bond Sell-Off
With incessant dollar ‘collapse’, dollar ‘end of the road’, inflation ‘rampant’, yada-yada, day after day, it’s no wonder bonds have sold off.
At this juncture, there’s either a reversal and much higher levels or down, with rates higher; in turn, leading to the subsequent collapse of real-estate, a-la 2007 – 2008.
Summary
Would I personally be a bond buyer at this point … no. I’m not keen on buying the debt, any debt of a bankrupt nation (not advice, not a recommendation).
It’s important to note, if bonds do rally, the catalyst may be a perverse ‘flight to safety’ on the public’s part resulting from significant downside in the overall markets.
Note: Posts on this site are for education purposes only. They provide one firm’s insight on the markets. Not investment advice. See additional disclaimer here.
Note: Posts on this site are for education purposes only. They provide one firm’s insight on the markets. Not investment advice. See additional disclaimer here.
Note: Posts on this site are for education purposes only. They provide one firm’s insight on the markets. Not investment advice. See additional disclaimer here.
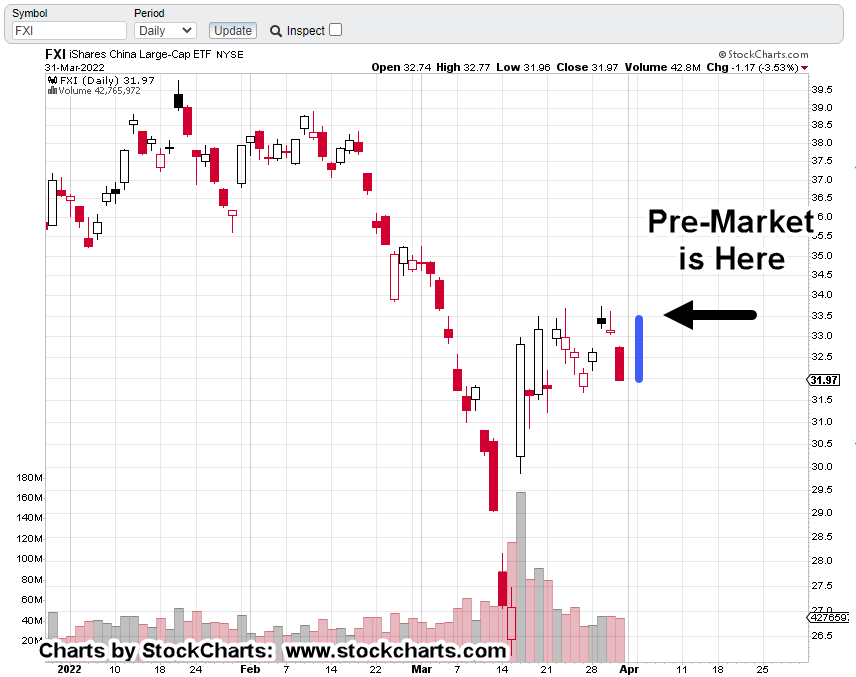
The daily chart of FXI below has pre-market action as the blue line.
Currently, we’re sharply higher but still below the March 30th, high.
FXI, Daily Chart
The next chart shows the March 29th, recovery high.
For the market to continue a next leg higher, obviously, it needs to penetrate that high.
Inverse (YANG) Fund Tracking Errors
At this juncture, about 30-minutes before the open, YANG is trading at 14.01 – 14.09, slightly below the 14.16, stop.
Even though FXI is not above the March 30th high (used to locate the YANG stop), the inverse fund is trading slightly below that stop level.
This is the tracking error that’s common with every leveraged inverse fund.
Trading Action
We’re either in a ‘gut check’ upward move in FXI, before reversing to lower lows, or it’s the start of a next leg up.
Words of wisdom from the late David Weis … ‘Prove it’.
If this is the next leg higher, FXI must first penetrate the March 30th, high of 33.62, then penetrate the March 29th high of 33.73.
Using that requirement (of higher highs), the plan is to partial exit YANG if/when FXI penetrates the 33.62 high and full exit at penetration of FXI: 33.73 (not advice not a recommendation).
Summary
With each price action move, FXI is successively removing the probability of repeating the same action(s).
We had a short-covering gap higher during the week of March 18th. That massive volume move is not likely to be repeated.
We now have what may be a ‘gut-check’ move testing current highs. This move would also join the ranks of price action that’s not likely to be repeated.
If FXI, is unable to move higher from this juncture, it weights the probability even more to the downside.
Note: Posts on this site are for education purposes only. They provide one firm’s insight on the markets. Not investment advice. See additional disclaimer here.
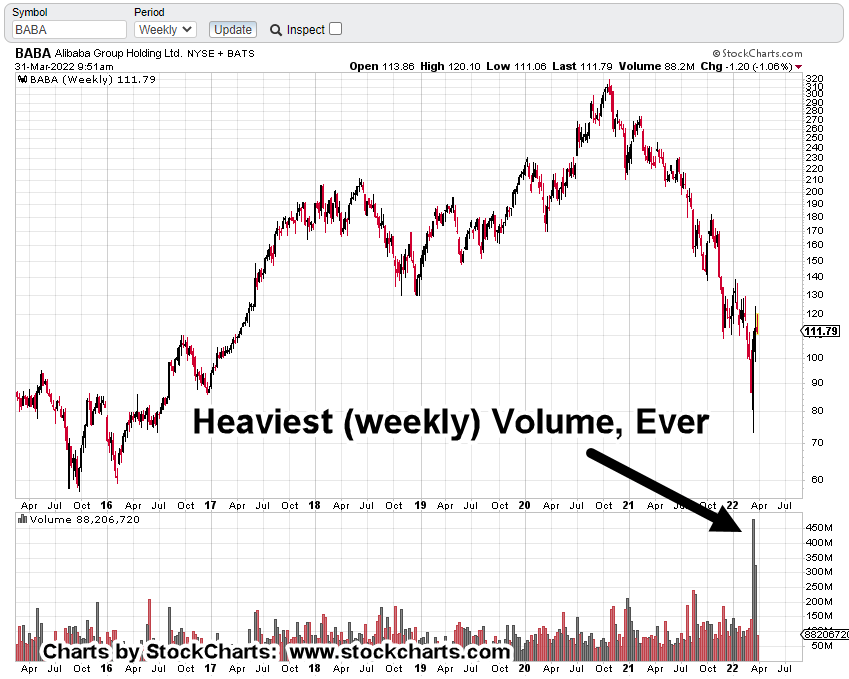
On one hand, BABA, has launched more than 60%, off its most recent lows.
On the other hand, that launch posted the highest daily, weekly monthly, and (about to be) quarterly volume, ever.
Markets tend to come back and test wide bar, high volume areas. Just that probability alone, coupled with the unprecedented volume behavior on four timeframes, points it to the bear side.
Shorting China FXI, via YANG, discussed yesterday (not advice, not a recommendation), is essentially a BABA short as that equity is weighted more than 10%, in the FXI.
So, let’s take a look at what BABA, is saying about itself.
BABA, Weekly Chart
The massive weekly volume highlighted below.
Next, we have a not-so good-looking picture (for the bulls).
BABA may be posting a long-term Head & Shoulders top.
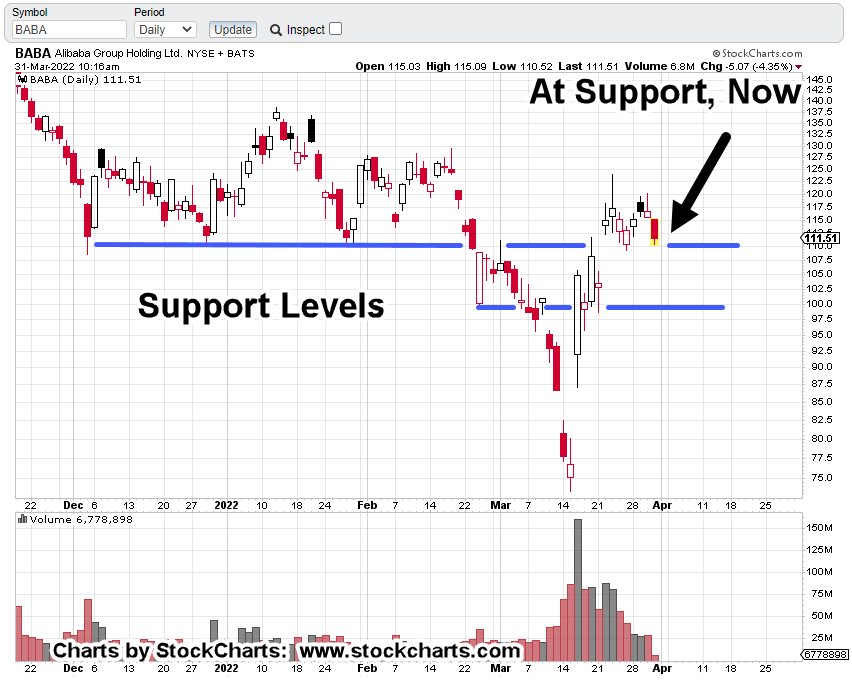
Next, is the daily with its largest volume ever as well.
Getting closer-in on the daily, there are support levels to watch.
At this juncture, early in this session, we’re at support now. Breaking down puts the next, less defined support into play.
Positioning
The last post, showed what was then current positioning in FXI leveraged short vehicle, YANG (not advice, not a recommendation).
During the session yesterday, the YANG position was increased substantially. Essentially, the low-risk opportunity was used to its fullest advantage.
This method of trading goes way back to Livermore, Wyckoff and Loeb
Livermore:
Focus on the big picture and strategy. Look for the (potential) big move.
Wyckoff:
Use what the market is saying about itself to find the danger point. The point of least risk.
Loeb:
Real market opportunities are rare. When one is found, it must be used to its fullest extent.
Do NOT diversify. Focus positions and time the market.
Summary
As always, anything can happen.
BABA is currently at one of its support levels and holding for now … bulls still have a chance.
Obviously, the active trade, YANG-22-01, is taking the bearish stance. The plan is to have a tight, in-the-green stop, soon (possibly today’s low).
As this post stated at the outset, we’ve got all time high volume on four timeframes: Nearly a bearish case in itself.
The high-volume area may be tested.
That means BABA (and FXI) price action would need to move lower to perform that test.
Note: Posts on this site are for education purposes only. They provide one firm’s insight on the markets. Not investment advice. See additional disclaimer here.
Note: Posts on this site are for education purposes only. They provide one firm’s insight on the markets. Not investment advice. See additional disclaimer here.
The analysis used in the video is different from what’s on this site … and that’s ok.
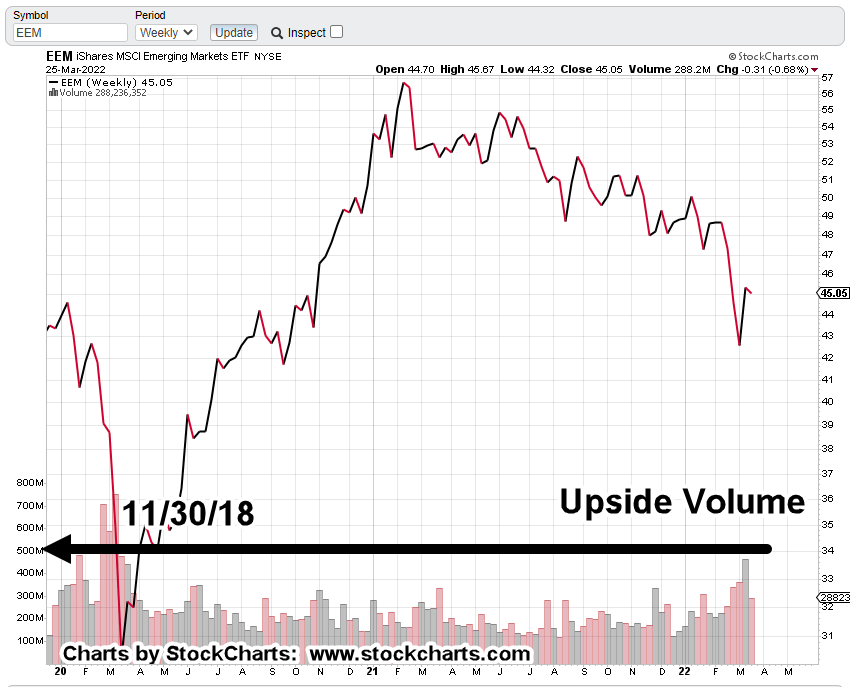
The probability conclusion is the same, i.e., EEM down.
The takeaway from the video, is the timeframe. If the cycles in the analysis are in-effect (time stamp 8:04), then EEM potentially bottoms-out, in late June or early July.
Summary
The initial short trade via EDZ (EDZ-22-01) was exited, with profit on March 16th.
Another attempt made, on the 17th – 18th (EDZ-22-02) but exited on the 18th, with a moderate loss (-6.5%).
From the 22nd – 24th, another position was opened.
EDZ-22-03, currently in the green at +1.9%.
Stop is set at EDZ: 10.55 (not advice, not a recommendation).
Parting Shot
A quick check of ZeroHedge, has the usual suspects out fomenting falsehoods; attempting induce more fear and misdirection of the masses.
Note: Posts on this site are for education purposes only. They provide one firm’s insight on the markets. Not investment advice. See additional disclaimer here.
Huge truth bombs from a just released Stew Peters broadcast, linked here.
At time stamp 15:25, one of the major truths is Taiwan; specifically, Taiwan Semiconductor, TSM.
Why Taiwan?
Why focus on Taiwan Semi and its connection to the Emerging Markets, EEM, ETF?
We’re focused on it because that’s what the tape itself is telling us to do. The EEM, has already been in a sustained downtrend since mid-February, last year.
It’s been three successive (chart) quarters of lower lows and lower highs.
Looking at semiconductors in general, out of the top ten market cap equities in the SOXX, only TSM, is at or below its 23.6% retrace level. All others have rebounded much higher.
As Wyckoff said a hundred years ago … ‘somebody always knows something.’
Meaning, those really in charge (time stamp 2:53, above) already know the plan; their actions show up on the tape.
We’ll look at those tape actions with TSM below
Taiwan Semi TSM, Daily Bar
Moving closer in on the daily, we have the following.
It’s clear, at this juncture, price action has stalled.
Two sessions ago (Wednesday, 23rd) there was an outside down (reversal) bar.
This session and yesterday’s, have been inside action so far.
There has been no new high or low, posted.
Although today’s action posted below yesterday’s low, it has not posted (currently, at mid-session) below the reversal low.
Summary
Anything can happen.
Price action, TSM could launch upward past the resistance and continue to a 38.2%, retrace.
At this point, it seems to be low probability; all the good news (i.e., the short squeeze), may be out.
We’re heading into the weekend and we’ve seen over and again, that’s when things go sideways.
As Livermore said, ‘surprises tend to happen in the direction of trend’.
TSM, is and has been, testing the underside of its breakdown; it now appears poised to continue lower.
Note: Posts on this site are for education purposes only. They provide one firm’s insight on the markets. Not investment advice. See additional disclaimer here.