Note: Posts on this site are for education purposes only. They provide one firm’s insight on the markets. Not investment advice. See additional disclaimer here.
We have the usual suspects rolled out; providing expert analysis on why gold went down.
The answer is quite simple. It tested a trend break, then reversed.
If we look at the (close) chart of GLD, it broke an uptrend during the week of November 20th, last year; went lower and then back to test.
That test was rejected dramatically with Gold (GLD), heading significantly lower; getting whacked down over 5%, in just two days.
This is not bull market behavior.
Steven Van Metre’s assessment (at this juncture) that we’re in a deflation event is being shown correct. The lagging factor in the scenario is the overall market … still near all-time highs.
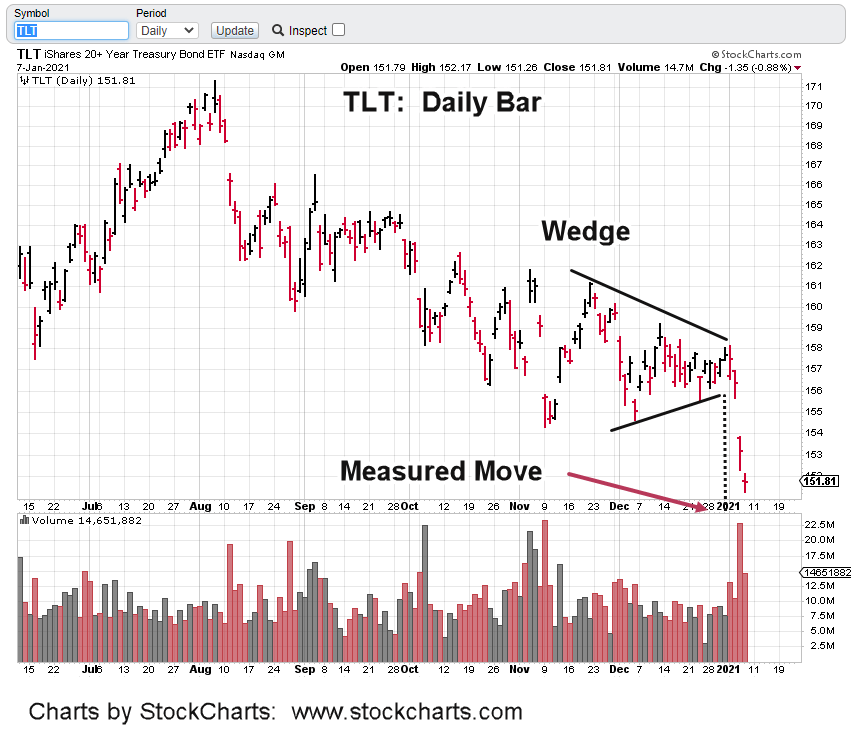
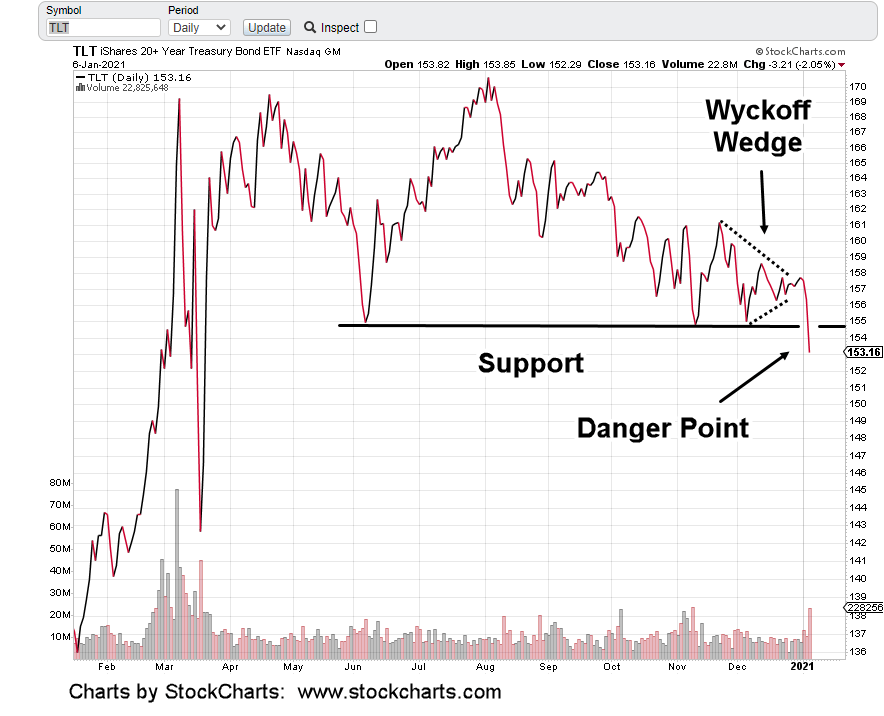
It’s true bonds broke lower (rates up) this week but that’s another event answered by technicals; the wedge formation, discussed here.
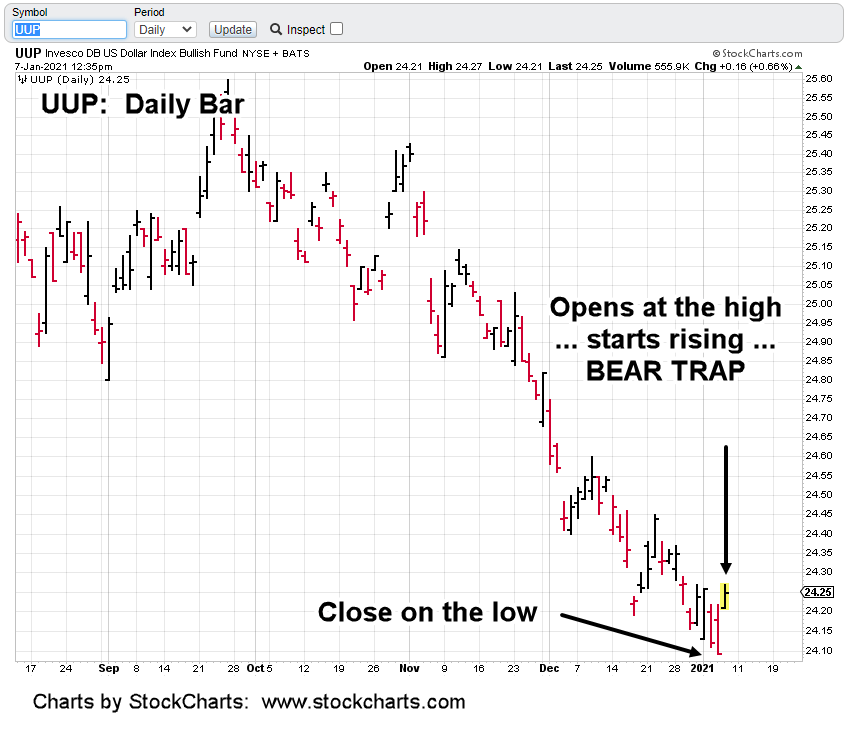
Both bonds and the dollar have set the stage for a swift reversal.
Just how that’ll affect an extended, obscenely overvalued, stretched, call options wild market with everybody all-in, is not known.
Getting back to Van Metre; he’s reported, during this past week, small traders/speculators added to short (bond) futures positions.
If there’s a signal bonds are stretched, ready to reverse, it’s the little-guy just now getting in (going short) …. right at the bottom; as usual.
Note: Posts on this site are for education purposes only. They provide one firm’s insight on the markets. Not investment advice. See additional disclaimer here.
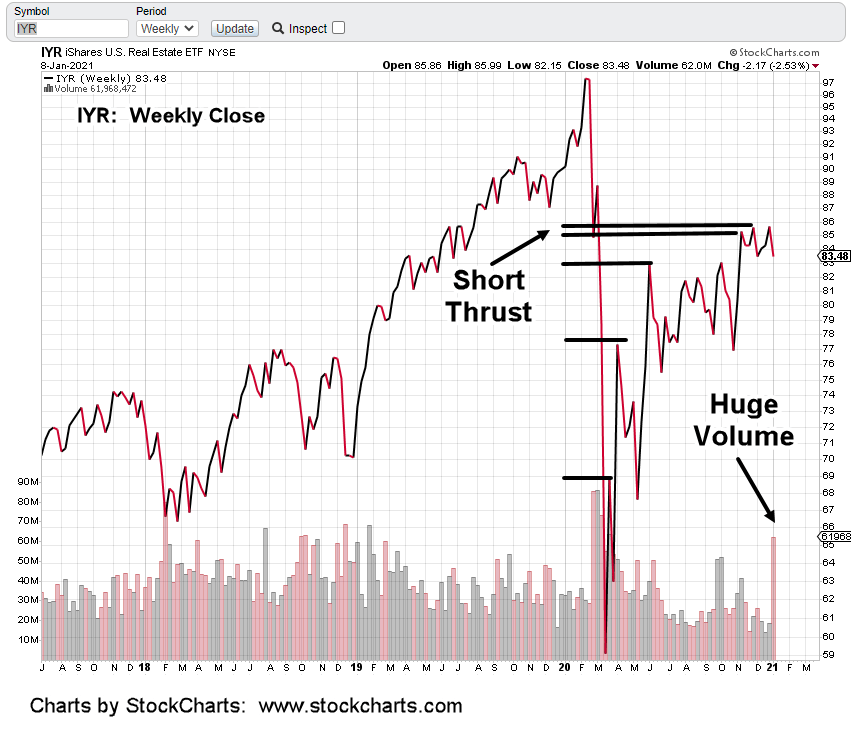
As markets power higher, real estate topped last November; its been dead ever since.
IYR is telling us something. That something may be it’s about to be one of, if not the leader to the downside.
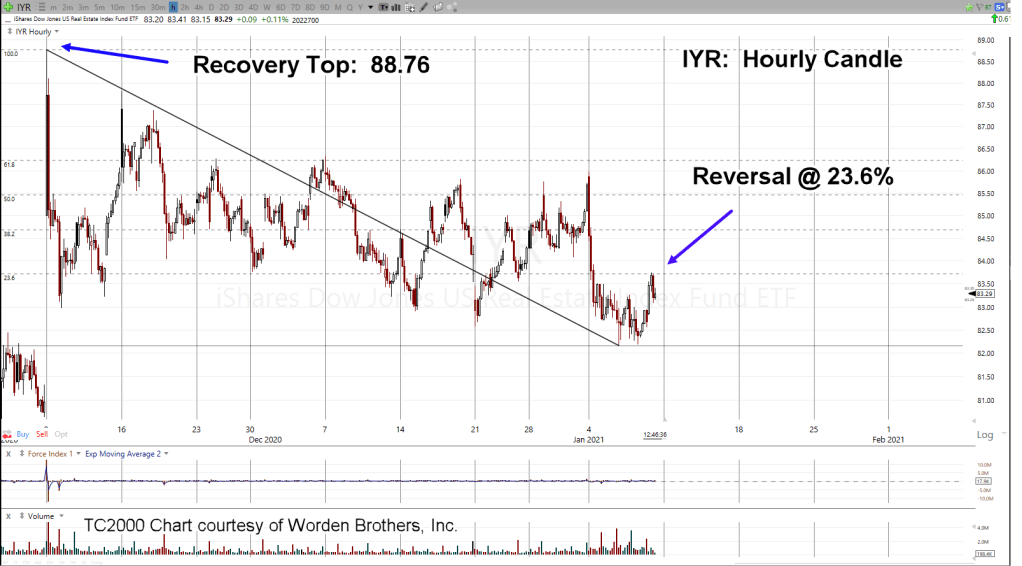
The last report said IYR is breaking down. This morning’s action was an upward test, then reversal.
Testing at Fibonacci 23.6%, (shown above) then reversing indicates severe weakness.
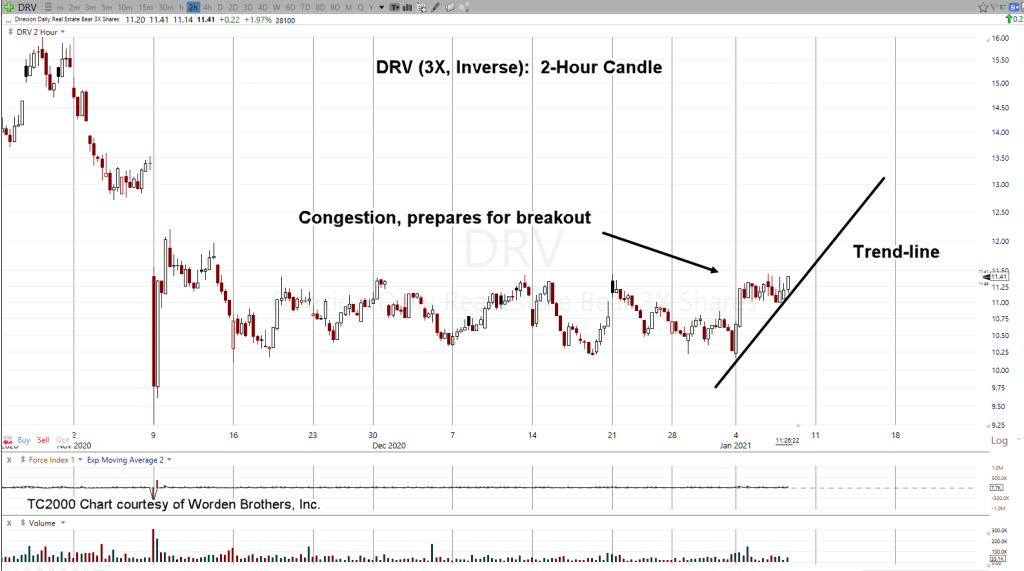
Inverse fund DRV (3X inverse IYR) is moving back into its prior trading range (11.00 – 11.50) after pushing lower in the early session.
Today could be the day. The day were real estate (IYR) begins a dynamic drop to much lower levels.
Note: Posts on this site are for education purposes only. They provide one firm’s insight on the markets. Not investment advice. See additional disclaimer here.
Note: Posts on this site are for education purposes only. They provide one firm’s insight on the markets. Not investment advice. See additional disclaimer here.
Note: Posts on this site are for education purposes only. They provide one firm’s insight on the markets. Not investment advice. See additional disclaimer here.
DRV is the 3X inverse tracking fund for real estate, IYR.
Price action is now breaking higher (IYR, lower).
The 2-Hour chart of DRV (above) shows the trend.
There’s always a chance price action at the trading range lows in IYR, is a potential reversal to the upside.
With the overall markets at new highs, and IYR dead-in-the-water, probabilities favor downside action (DRV higher).
Note: Posts on this site are for education purposes only. They provide one firm’s insight on the markets. Not investment advice. See additional disclaimer here.
Note: Posts on this site are for education purposes only. They provide one firm’s insight on the markets. Not investment advice. See additional disclaimer here.
Note: Posts on this site are for education purposes only. They provide one firm’s insight on the markets. Not investment advice. See additional disclaimer here.
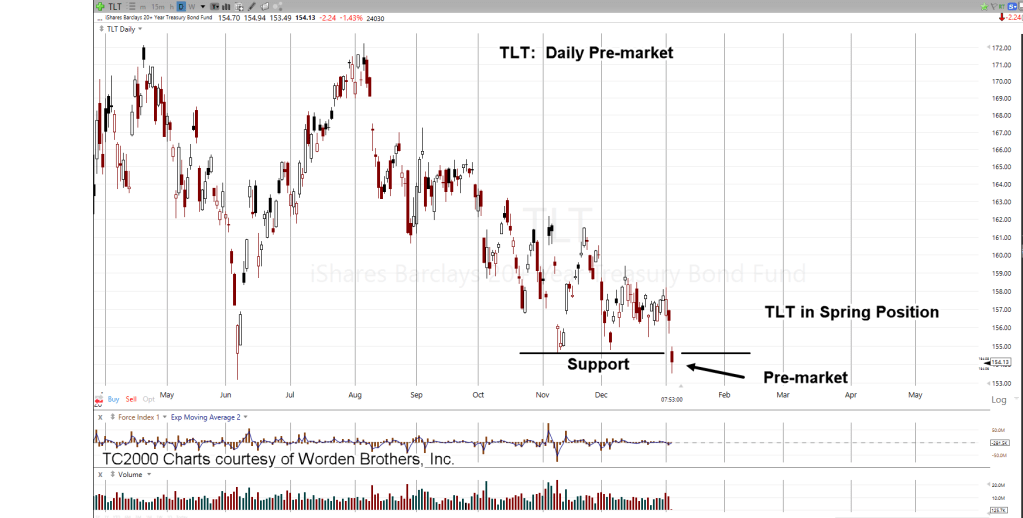
It’s busy in the pre-market and the big story is bonds.
The last update, using Wyckoff as the example, said bonds would break to the upside from the wedge formation.
Sometimes before such a break, there’ll be a momentary push in the opposite direction. Then the real (reversal) move starts. That may be what’s happening now.
Looking at TLT, pre-market is trading below well-established support. If that’s where TLT opens, it may be the last gasp for the bears.
Note: Posts on this site are for education purposes only. They provide one firm’s insight on the markets. Not investment advice. See additional disclaimer here.
There’s nothing more dramatic and profitable than a failed move.
The controlling party, bulls or bears push the market in their direction; only to find out, there’re out of fuel.
The opposing side has been gathering forces to mount an offensive.
Perhaps the most famous ‘gathering of forces’ was the failure of Long Term Capital Management.
If memory serves correctly, it was Goldman Sachs that found out LTCM was over leveraged and overextended.
They used that data for their benefit.
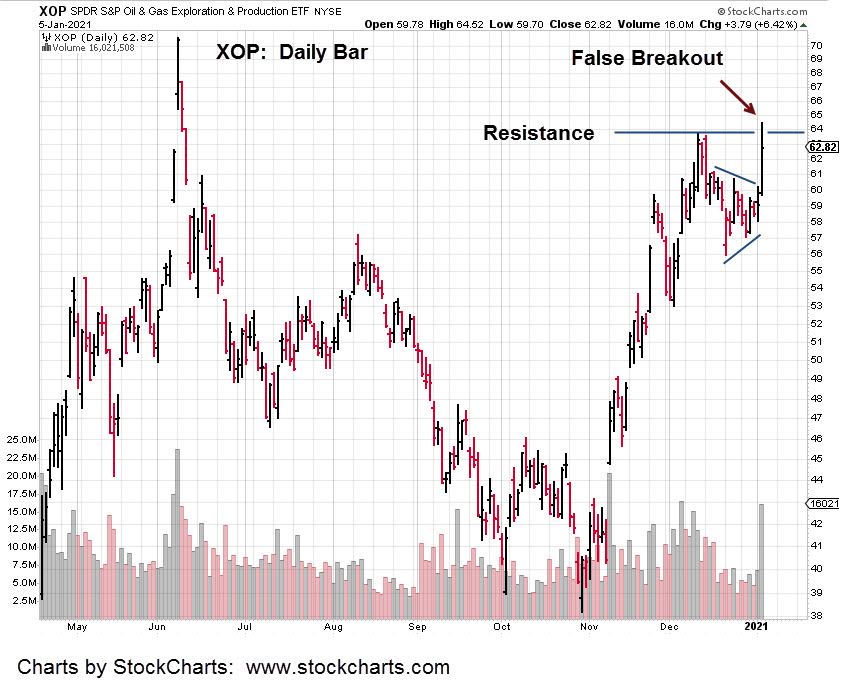
That’s not to say the failed move in the Oil & Gas Exploration (XOP) market is anywhere near the LTCM level. Just saying, markets are fractal and failed moves occur on all time frames.
The daily chart of XOP shows the failed attempt to break above resistance.
Price action was swift in the early session; then stalled at mid-day and retreated quickly into the close.
That retreat brought price below resistance … indicating significant weakness.
The short position in biotech (via BIS) was profitable but it did not have the potential for swift action like shorting XOP.
Since the firm follows the tenets of Gerald M. Loeb (late Vice Chairman of E.F. Hutton), we do not diversify.
Trades are focused on specific price action; therefore, tend to be concentrated only in one or two markets at any time.
We know from a fundamental standpoint, there’s no (or very little) demand for oil and the by-products. Steven Van Metre has contacts in the field that are feeding him information on what’s really going on.
While some of the minions that watch his updates complain about the colors of his moving averages, we’re more interested in the anecdotal data such as ‘oil inventories are piling up’.
Even better was the comment (a few weeks back) that EIA data is not telling the whole story. There’s even more oil than what’s in the report.
That’s our backdrop for shorting the XOP by using DUG. Not advice, not a recommendation.
Recall that DUG, with regards to the firm’s broker, has stated “not marginable” indicating especially high volatility.
Note: Posts on this site are for education purposes only. They provide one firm’s insight on the markets. Not investment advice. See additional disclaimer here.