As of 3:19 p.m. EST
Closed BIS
Entered DRV and DUG
Analysis to follow. Not advice, not a recommendation

As of 3:19 p.m. EST
Closed BIS
Entered DRV and DUG
Analysis to follow. Not advice, not a recommendation
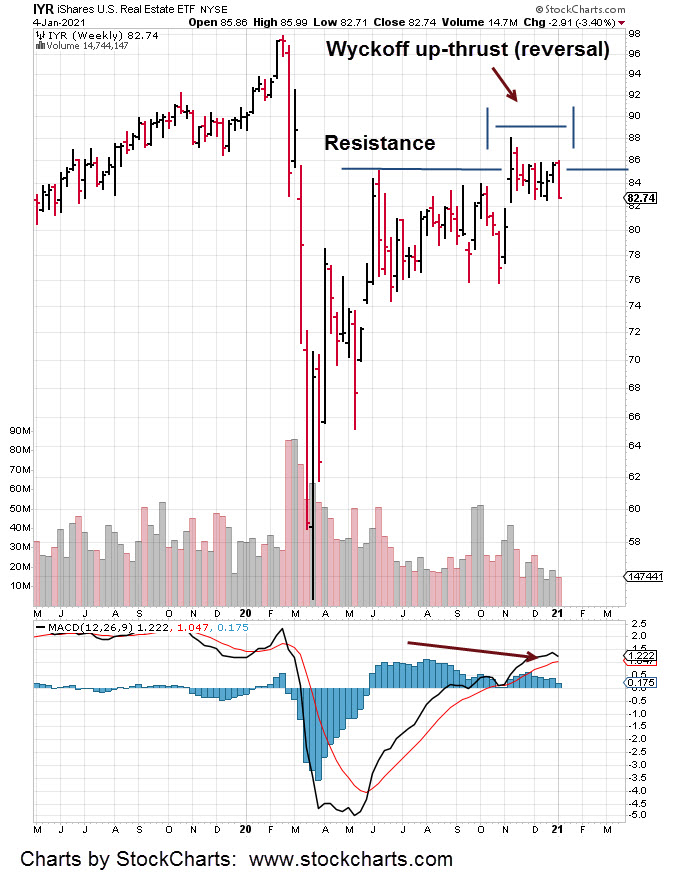
The real estate index IYR has been struggleing at resistance for months. Yesterday’s action was a swift break lower to the bottom of the range.
Inverse fund DRV (3X inverse IYR) had is largest single day gain since mid-May of last year.
The weekly chart shows the four-month struggle at resistance as well as MACD bearish divergence.
IYR may attempt to test slightly higher (DRV down) during this session.
If so, we’ll be looking to position short via DRV; not advice not a recommendation.
Moving on to biotech. Yesterday’s action was a good example of negative bias in LABD. Even though IBB closed lower, LABD closed lower as well.
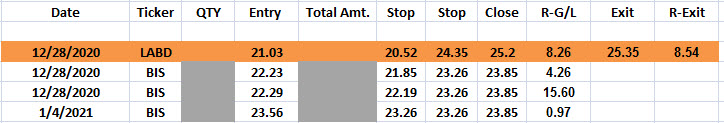
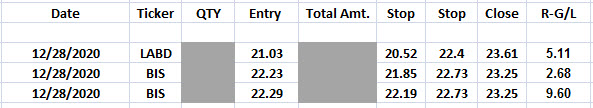
The LABD position was closed out as shown (above) and the BIS positions maintained.
Note the R-Exit value.
This represents the gain on the amount risked. If $1,000 was risked on the trade, it returned $8,540.
Update will be forthcoming if/when a DRV position is established.
Charts by StockCharts
So, this is it?
As this juncture (11:06 a.m. EST), both the Dow and S&P have key reversals; and now the QQQs, and Russell 2000, have just joined them.
If they hold and decline from here, reversing from all time highs, we can add that data to our empirical “Holiday Turns”
Holiday turns … markets tend to reverse just before, during, or just after a holiday week.
In the biotech arena, this morning’s gap higher (IBB) closed the distance from price action to the stop for inverse funds BIS and LABD.

That closure opportunity was used to increase the short position (via BIS) in one of the managed accounts. Not advice, not a recommendation.
The IBB bearish divergence is beginning to take shape.
Positions:
Note: “Close” prices as of 11:03 a.m. EST
Charts by StockCharts
About a year after Teddy Roosevelt left office, Wyckoff published his seminal work; Studies in Tape Reading. That year, was 1910.

Wyckoff was the one that defined support, resistance, accumulation and distribution.
He was the one that discovered markets have a power of their own; having nothing to do with any fundamentals.
Wyckoff found that if you can decipher price action, you can determine the most probable direction.
A first edition Wyckoff ‘Tape Reading’ text … if you can find it, goes for about $3,500.
Even lesser known books of Wyckoff such as this one, go for hefty sums.
In his ‘Tape Reading’ text, on page 102, he shows a diagram that represents price action exhaustion.
His discussion (repeated below) is concerning the bull side.
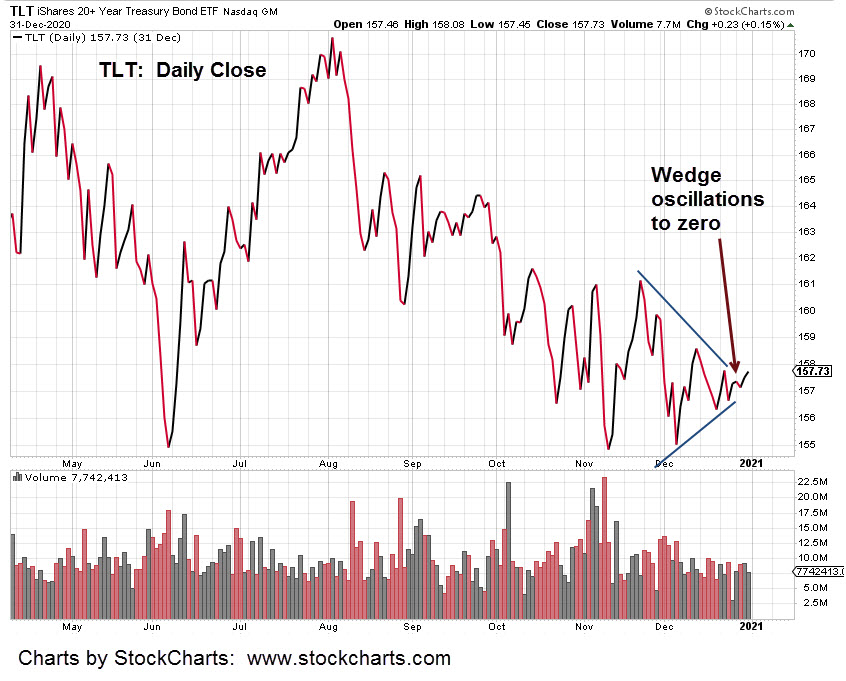
For today’s chart of TLT, we’ll mentally swap every ‘bull’ notation from Wyckoff with ‘bear’ and conversely, every ‘top’ notation with ‘bottom’, every ‘buy’ notation with ‘sell’ and so on.
“ … and you see what the chart of a stock or the market looks like when it reaches a point of dullness.
These dull periods often occur after a season of delirious activity on the bull side. People make money, pyramid on their profits and glut themselves with stocks at the top. As everyone is loaded up, there is comparatively no one left to buy and the break which inevitability follows would happen if there were no bears, no bad news or anything else to force a decline.”
The ‘dull’ period he is discussing is shown below in TLT. It has repeated the diagram on his page 102, in near identical fashion.
We have supplementary evidence from Steven Van Metre during this report, the bond bears have started to back off their historic short positions.
They are trapped and exhausted; all their selling has not collapsed bonds as anticipated.
So, let’s see what happens next. According to a text written 110-years ago, we are expecting a rally in bonds .. a massive rally.
Quotes used with permission
Charts by StockCharts
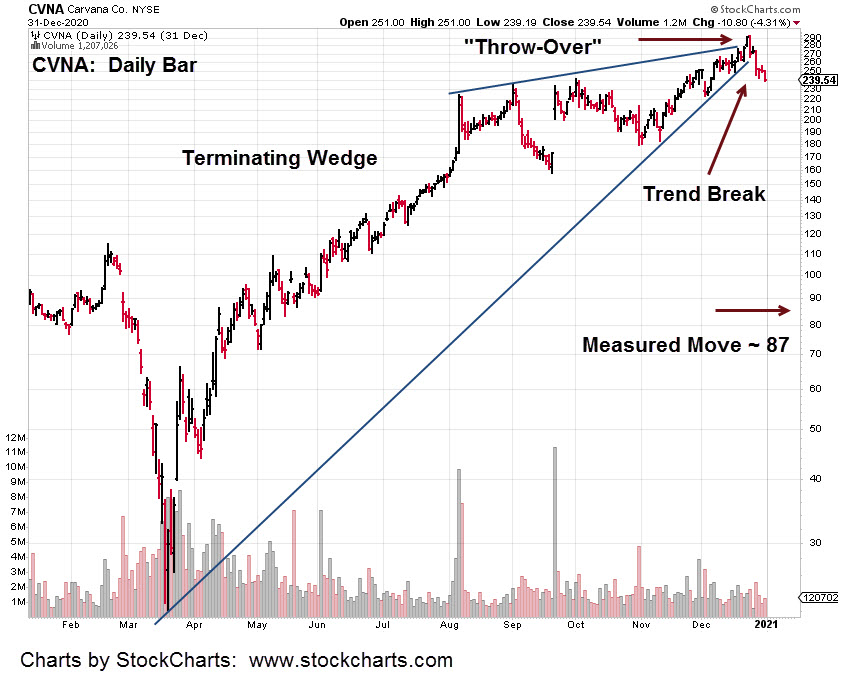
Carvana (CVNA) has no P/E ratio.
It’s almost like Dean Wormer, discussing the Delta House’s grade-point average; “Mr. Blutarsky, Zero-point-zero.”
From a chart perspective, CVNA has spent the past nine months forming a terminating wedge.
That wedge had a breakout to the downside during the last trading week of 2020.
No amount of positive bias last Thursday, (markets making new highs) was able to lift CVNA.
The stage is set.
Measured move from the nine-month wedge projects CVNA to the 87, area; a -63.7%, decline from current levels.
Charts by StockCharts
Between BABA, 251 and 253, we can expect a test and reversal.
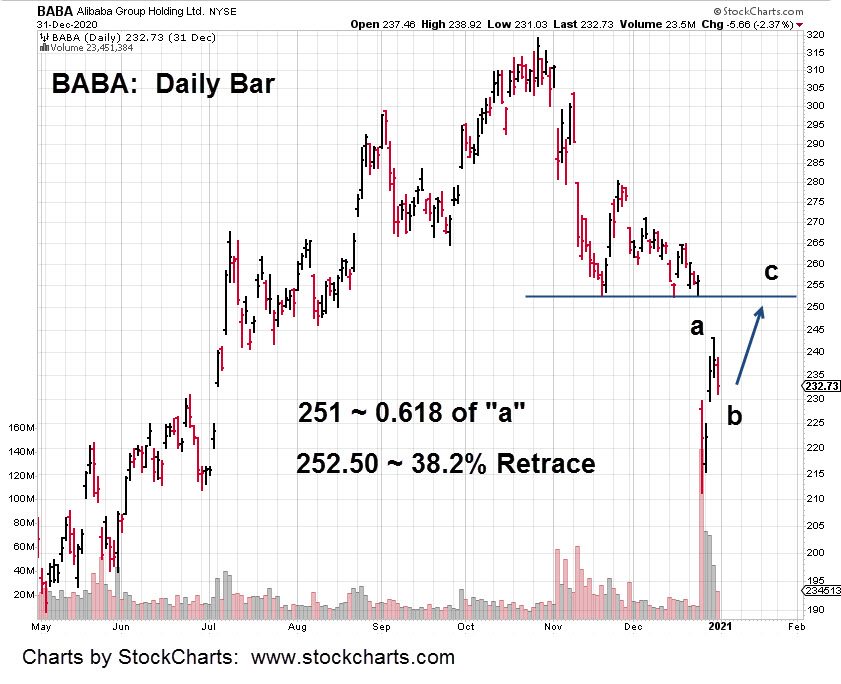
Thursday, December 31st, Fibonacci Day 5, from the most recent low.
Wednesday, January 6th, is Fibonacci Day 8, from the low.
Charts by StockCharts
Ever since the inland hurricane, the ‘Derecho’ of August 10th, it’s never been the same for corn.
Now, it’s going vertical.

The entire U.S. agricultural food supply infrastructure is being systematically dismantled. Control the food, control the population. Simple.
It seems the ‘preppers’ tend to focus on stockpiling silver and gold.
If your’re getting ready for what’s coming, from a historical perspective, that’s not the place to start.
Going way back …. thousands of years, during the famine in Egypt of Joseph’s time, we have this:
“And Joseph gathered corn as the sand of the sea, very much, until he left numbering; for it was without number”
“And the famine was over all the face of the Earth: and Joseph opened all the storehouses and sold unto the Egyptians: and the famine waxed sore in the land of Egypt.”
“And all countries came unto Joseph for to buy corn; because that the famine was so sore in all lands.”
Gen 41: Vs. 49, 56, 57, KJV
They paid for the corn first, with gold and silver. Then they paid with their livestock. Then they paid by selling themselves into life-long slavery. We can equate that last part (slavery) as getting the vax.

As corn is going vertical, the bond market is signaling its move as well.
Just now, today, TLT is rotating higher.
Yesterday, Steven Van Metre showed a chart (time stamp 10:00) of the speculators beginning to back off their historic short position.
They’ve figured out they’re trapped. Now, they’re trying to sneak out the door without being completely impaled on a sharp bond spike.
The S&P, Dow, NASDAQ, Russell 2000, all appear to be holding near their highs.
Biotech (IBB), as reported yesterday, is different.
Something major is brewing below the surface with the biotech deception. Price action itself is showing it’s the place to be for the short-side.
Further info on biotech’s downside is here and here.
Positions remain unchanged (as of 3:02 p.m. EST). Stops have been moved; not advice, not a recommendation.

Charts by StockCharts
Markets press on, new highs. However, biotech (IBB) is losing luster.

It could be just a temporary blip on the road upward.
Or, there could be something else afoot not known to the general public … and possibly not even known to professional speculators and market traders.
The video link below is to an alternate (independent) platform. One among many popping up in response to ‘adjustments’ being made by YouTube.
The video at this link is nearly an hour long. It’s one of those things that upon viewing the entire presentation, one can never be the same.
Viewer beware. For those with short attentions, fast forward to Time Stamp 22:50, for the meat.
Wyckoff stated a century ago ‘the reason for a move is always revealed after the fact’; we might find if IBB reverses from here and does not look back, the link above may ultimately become the ‘reason’ for such a move.
Imagine if this presentation becomes widespread knowledge … where will biotech be then?
Of course, price action is always the final arbiter. Positions (and stops) remain unchanged.
Gold miner (GDX) bulls and bears have been fighting in a crowded trade since late November.

This morning’s GDX retrace up (and now down) from yesterday is a case in point.
In such a choppy environment, inverse funds lose market value (downside bias) quickly and trades need to be avoided.
Meanwhile, on the other side of the market, biotech (IBB) has formed a top, reversed, and posted a new weekly low today.
An hourly trend-line has been formed as well (not shown).
If it holds as (or if) IBB declines past current support (~152 area), that hourly trend is moving lower at just over -96%, annualized.
Maintaining negative trend, with declining momentum on both daily and weekly timeframes is what we’re looking for.
The objective (not advice, not a recommendation) is to move stops (shown below) and maintain the trade until stopped out or trend break.

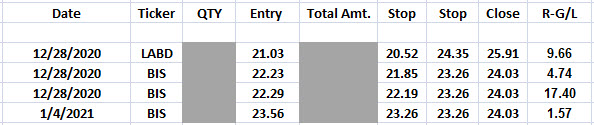
As of this post (1:03 p.m. EST), the current price of LABD and BIS are listed in the ‘Close’ column.
The “R-G/L” is from Dr. Van Tharp’s concept of Risk Gain/Loss.
Example: If $1,000 of capital was “risked” (entry-to-stop) on the LABD, position, that position is now up by 6.83-R, or $6,830.

Charts by StockCharts

It’s hard to describe how stretched the market really is; how ‘the euphoria is so maximized’, as quoted by David Quintieri of the Money GPS.
His latest report, delves into published articles that contain one market stretched quote after another.
Perhaps, the most frightening is: ”This does not feel like the top”.
You can find that report at this link. The quotes listed above and more, start around the 1:40, time stamp.
In the markets as of this post (2:08 p.m. EST), biotech (IBB) continues to erode throughout the session.
The firm has made one LABD (3X, Inverse) and two BIS (2X, Inverse) entries this session so far. Not advice, not a recommendation.
Note the stop progression on BIS entries.
Positions are below; not advice, not a recommendation:

