Volume increases on IYR; range contracts even further.
In what’s beginning to look like its been taken straight out of David Weis’ training video on ‘trend reversals’, volume has surged and range has contracted drastically.
The last update had range contracting down to 1.83% (from 9.77%).
Now we’ve got yesterday’s range down to 0.60%; volume up to 18-million shares … the highest since October 2nd, last year.
One of two things is happening.
It could be absorption for a new leg upward to ever higher, highs.
Note: Posts on this site are for education purposes only. They provide one firm’s insight on the markets. Not investment advice. See additional disclaimer here.
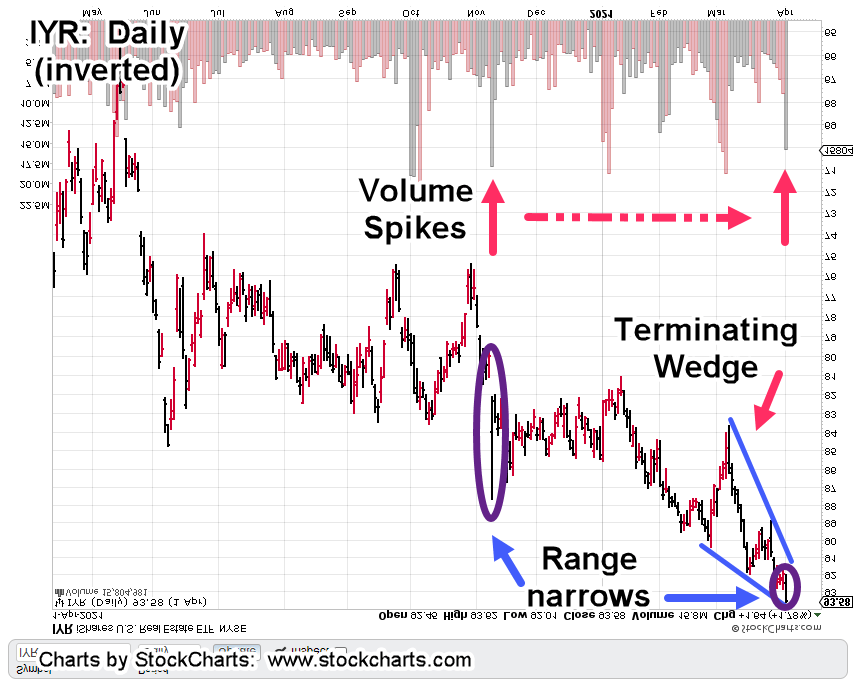
The inverted chart of IYR, shows the extremes of current price action.
The chart has a compressed time scale which may be hard to see. It was necessary to present it this way to show extreme action.
The prior update, has a wedge ‘throw-over’ that’s been one year in the making. The daily above, has its own terminating wedge formed over a six-week period.
The important part, is the range and volume.
Back on November 9th, 2020, there was a large volume spike and a move whose (total) range equated to 9.77%
Thursday, April 1st, was a similar volume spike but total range was just 1.83%; a huge (range) contraction when compared to the prior move.
This tells us massive volume is not having a significant result. Of course, if the volume persists, sellers in this area will be absorbed and IYR will move higher.
If not, this could be distribution; a reversal can be expected.
Note: Posts on this site are for education purposes only. They provide one firm’s insight on the markets. Not investment advice. See additional disclaimer here.
A long time ago in an interview whose source is long forgotten, the question was asked:
‘How many times do you attempt to enter a trade before giving up?’
Years ago as an amateur, I was shocked. I didn’t even know that several attempts could be made.
Was that even allowed?
I thought the ‘professionals’ were supposed to know the market. If they get stopped out, they must be some kind of (idiot or) shill.
Well, you can make your own call on that one … as for the ‘project’, we’re re-positioned for one more time.
Monitoring price action throughout the day, it became obvious just before 3:00 pm; EST, that IYR was going to make a breakout push.
The DRV short was exited at 7.48 and then, we waited.
The upside breakout came just twenty minutes before the close (forty minutes after exiting). IYR pushed significantly higher while DRV went sharply lower.
Ten minutes into the breakout, as IYR was still rising, DRV was re-entered at 7.358 (see table below).
Price action continued higher right into the close. DRV finished at 7.25.
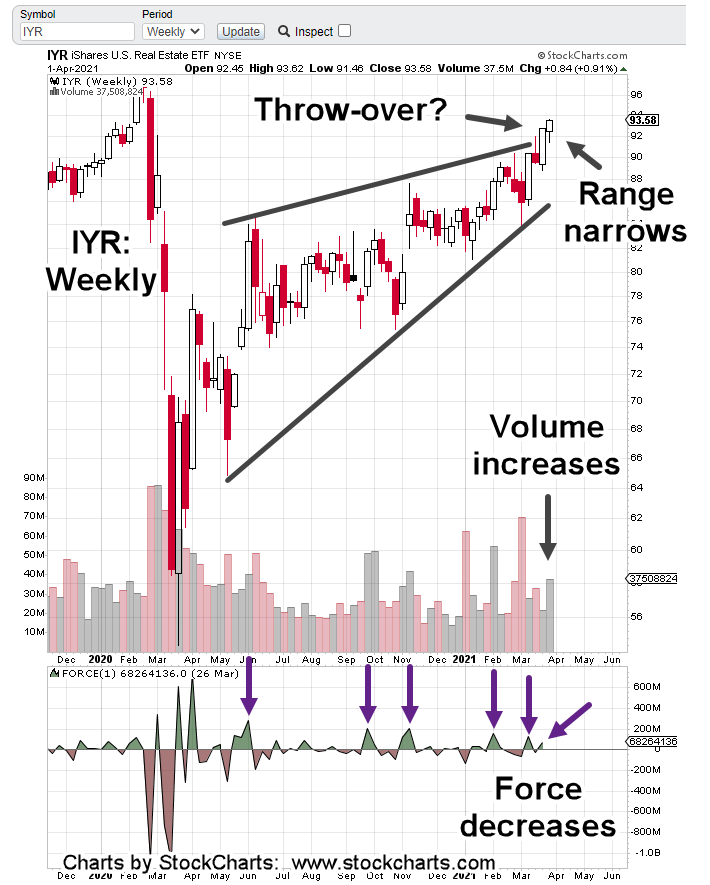
Looking at the weekly chart, the ‘throw-over’ looks terminal.
Price rose for the week but range was more narrow with volume (effort) up and force down.
The amount of volume needed to move price slightly higher increased significantly from the week prior.
Note: Each upside force (from start of the recovery) has declining energy.
For the week just ended, Force Index barely ticks higher while volume increased and range traveled decreased.
Wyckoff termed this “effort vs, result”. The bulls are tired.
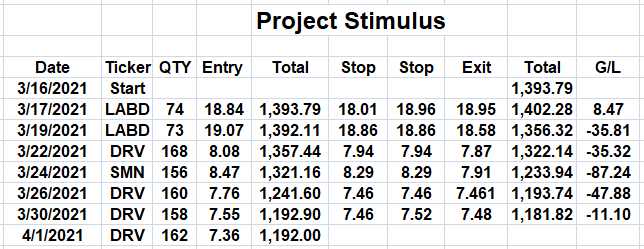
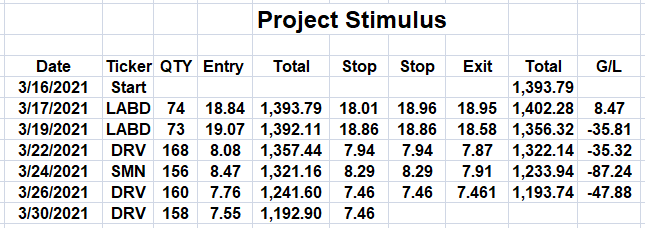
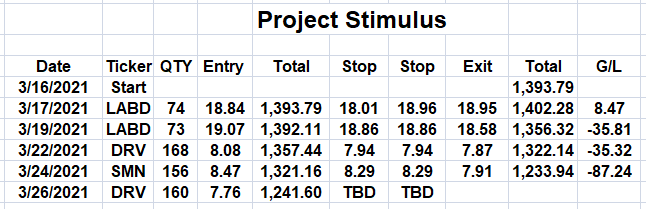
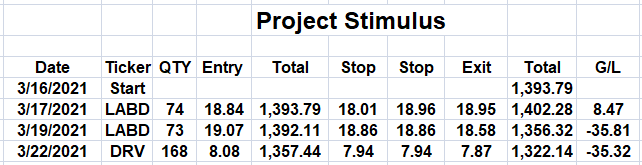
The table shows current status. We’ll decide on a stop (or exit) during the next session.
Note: Posts on this site are for education purposes only. They provide one firm’s insight on the markets. Not investment advice. See additional disclaimer here.
IYR made an unexpected print high; then failed to hold into the close.
The inverted chart of IYR puts it all in perspective.
It’s obvious we’re working the area of IYR, where medium to long term reversal is possible. The inverted chart shows how each successive thrust lower (blue lines) covered less net distance.
Instead of exiting out of DRV, then getting back in, the position was held with the expectation new IYR, print highs would not hold.
They didn’t.
Not only that, there was plenty of intra-day kabuki:
Early session lower, then reversal to new highs, then fail and lower close. Anything can happen but IYR’s upward action looks exhausted.
If IYR had maintained its new high into the close, DRV would have exited (not advice, not a recommendation).
Note: Posts on this site are for education purposes only. They provide one firm’s insight on the markets. Not investment advice. See additional disclaimer here.
Expectation was for a measured move higher … about 2 – 3 points.
As soon as price action penetrated the stop area, it reversed.
Shown above, is the re-entry (DRV) when IYR action posted an outside down hourly bar.
The chart below has more detail which indicates successive market rejections as price attempts to move higher
There are no guarantees. Some kind of demand could come in to move IYR higher.
However, based on the failed attempts to do so thus far, the market’s saying we’ve seen the highs for this cycle.
Note: Posts on this site are for education purposes only. They provide one firm’s insight on the markets. Not investment advice. See additional disclaimer here.
The stop on our ‘Project Stimulus’ account was originally listed as “TBD”.
The market itself needed to define the stop. Now, it has.
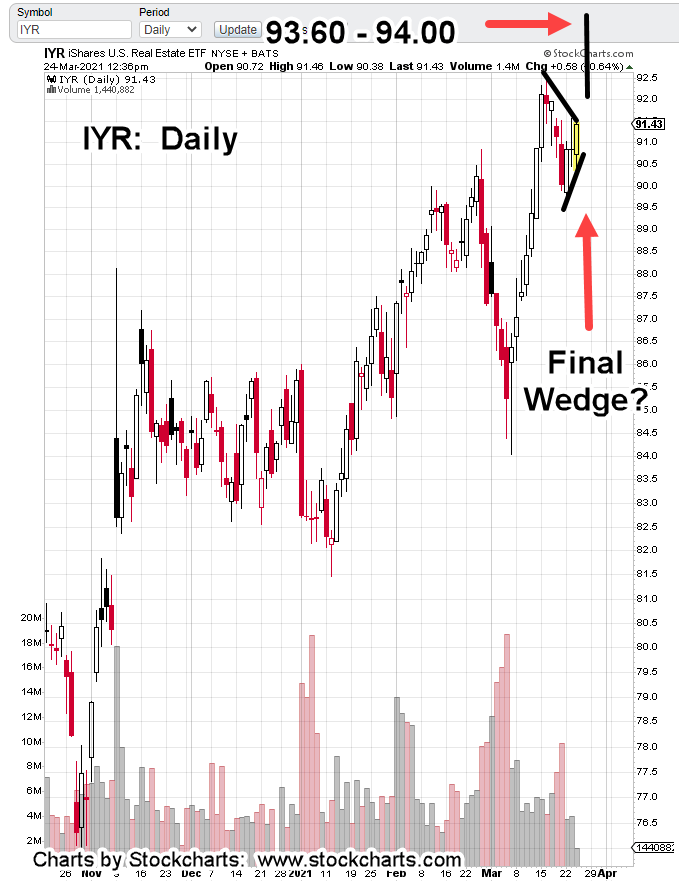
The 4-Hour chart of IYR shows a wedge pattern that’s right at resistance. The early session is over and posted a narrow red bar.
We’re just into the second half; price action is inching up.
If IYR gets above the inter-session high of 92.50, it’s likely to make one last push higher into a measured move.
We’re short via DRV (not advice, not a recommendation) so we don’t want to be around if that happens.
The Project table has been updated with an approximate location for a DRV stop:
Note: Posts on this site are for education purposes only. They provide one firm’s insight on the markets. Not investment advice. See additional disclaimer here.
We’re going to stay with chart labeling and retrace positioning as described in the last update.
The fact price action oscillated around the previous target (early in the session), then moved up, tells us there’s a more significant pattern at work.
Using that, we look at the AMT close. The ‘x’ location was a 38.2% retrace. Now, today (‘z’) we’re right at 50%.
Note the advance as slowed.
Net distance covered today is significantly less.
The parent index, real estate IYR, could not follow through to the upside; even after Friday’s aggressive move.
At session close, IYR just posted a reversal bar on the hourly chart.
We’re remaining short via DRV (not advice, not a recommendation).
Note: Posts on this site are for education purposes only. They provide one firm’s insight on the markets. Not investment advice. See additional disclaimer here.
‘The next twenty minutes are going be long and boring. You might want to skip to the end to see the conclusion.‘
His rabid and loyal fans then proceed to hang on every word of his self professed ‘boring anecdote’ until the very end.
Not saying this site’s in the same league as Harrell’s.
Just saying, the following is going to be a tedious discussion of American Tower (AMT) and how it just might be ready to start an Elliott Wave III, down.
Market Extremes:
Its been no secret. The markets are at price levels and valuations never before seen.
In this site’s opinion, going long anything, is insane.
There could be a break, upset, world event, container ship run aground (oh, wait…), cyber attack, volcanic eruption (oh, wait …), major earthquake, nationwide weather freeze (oh, wait…) food supply disruption (oh, wait…) bond bear raid (oh, wait…) currency devaluation, or any myriad of disconnects that would instantly change the dynamic.
Change the dynamic in such a way as to make low-risk long exit, or short positioning impossible.
This site has documented several times where major brokers have already gone off-line as a result of markets fluctuating to the upside.
What happens when it turns down? Good luck getting out.
Looking for the (short) entry:
Its been an on again, off again, and back on again affair with shorting real estate, IYR. Anecdotal evidence such as Jerimiah Babe’s updates from his area, show the market’s been vaporized and is not coming back.
We’ve shown from a Point & Figure chart perspective, IYR has built significant price action congestion.
In Wyckoff terms, congestion equals potential.
The IYR index has built enough congestion that if/when the reversal comes, price action has potential to decline below the 2009, lows.
American Tower (AMT) Symmetry:
Now, for the analysis of AMT.
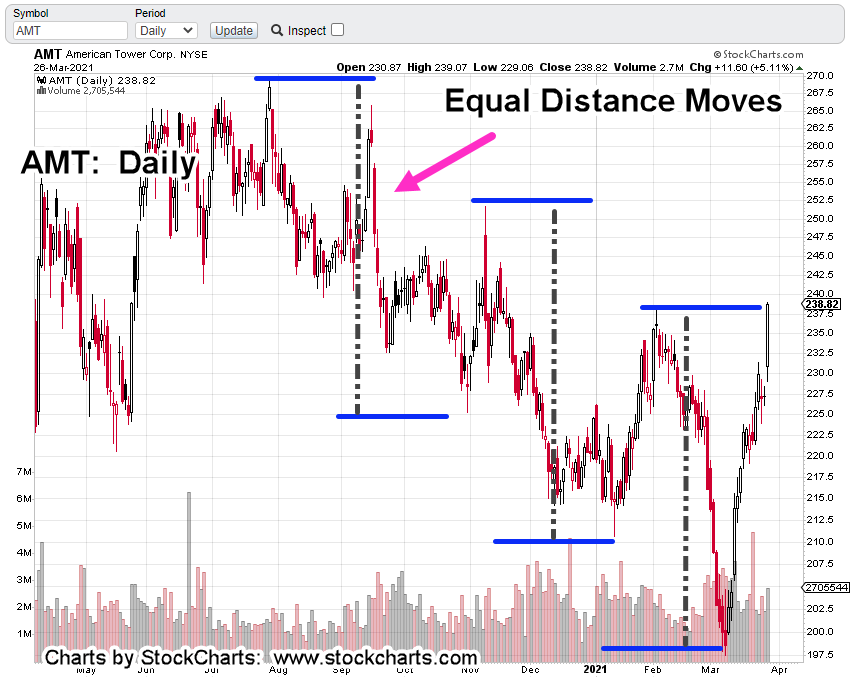
We’re going to start with the daily chart which has an interesting pattern of equal distance moves (or waves):
This equal move structure gives a hint that something’s up. The market’s moving in an orderly fashion. But what order?
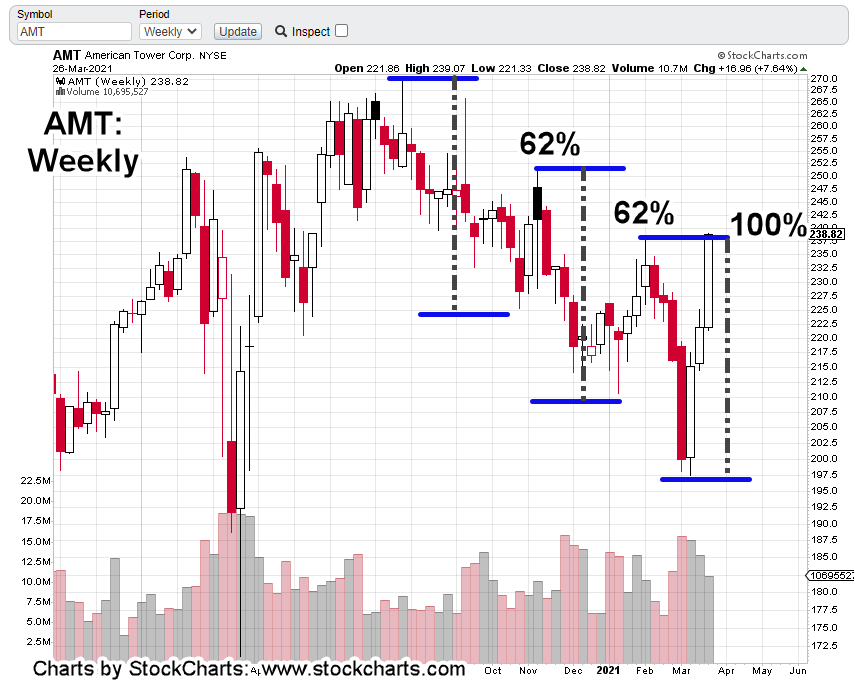
To add more intrigue, we’ll go to the weekly chart. We see each retrace of the two initial waves, was Fibonacci 62%.
The last retrace (up to Friday’s close) is essentially 100%.
Looking up Elliott Wave “equal waves” turns up this presentation. It helps some but does not cover the current situation. The take away from the video is that equal waves do occur.
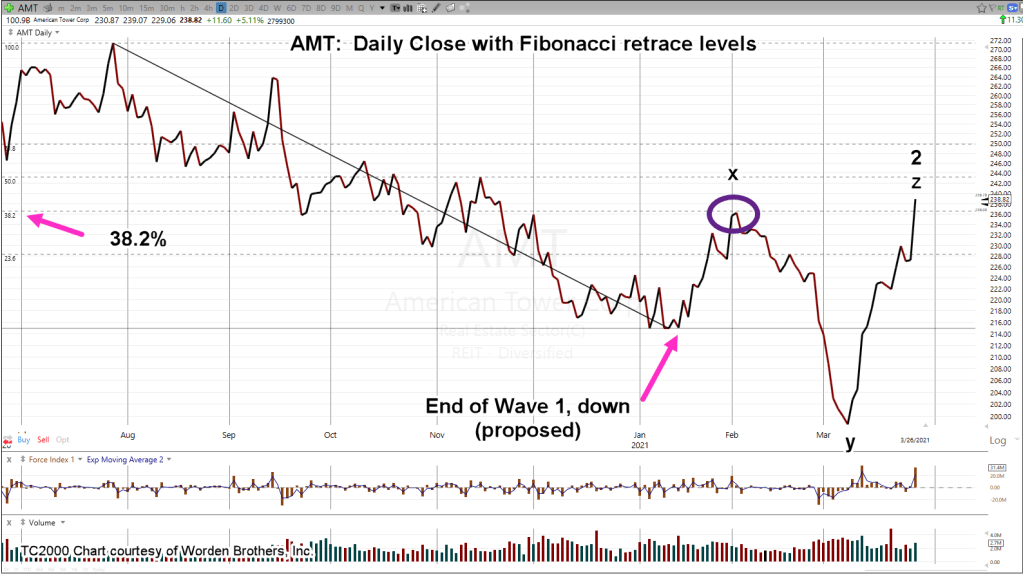
Looking at the daily close chart of AMT gives us this:
The Wave 1, down is placed at the low extreme. Price action then corrects to pivot (magenta oval) at the Fibonacci 38.2% retrace level.
It’s a near perfect retrace.
The reason to think AMT just finished a complex correction that terminated at “z” which is also “2”, is the structure of the fifteen-minute chart below.
The first chart is unmarked except where price action changes character:
Then we put in the Fib projection tool at that location; the inflection point, to get the following:
Incredibly, the top of Friday’s price action is also a Fibonacci target (423.6%) projection.
Getting back to the daily chart and labeling it using the above information gives us this:
Removing all but the labels is more clear:
There could be other ways to label the structure. It may become (very) apparent at the next open whether this interpretation is correct.
However, coupled with yesterday’s analysis of IYR, and its technical condition (at the extreme), we get the sense we’re close to some type of price action hesitation or outright reversal.
Summary:
We’re short this sector via DRV (not advice not a recommendation).
Price action appears to be at extremes and is meeting Fibonacci and support-resistance levels simultaneously.
Not related but an interesting coincidence (maybe): Van Metre’s update on Friday night:
“Is This a Sign Real Estate Prices Have Peaked?”
The futures markets just opened … S&P down 7-points. Let’s see what happens next.
Note: Posts on this site are for education purposes only. They provide one firm’s insight on the markets. Not investment advice. See additional disclaimer here.
It may have been Robert Prechter Jr. that said years ago;
‘You’re either going to be early, or late’
He then went on to say his trading method usually puts him in a little early on the move.
That means there are times when the anticipated direction does not materialize.
So, your either suffering through the pain of anticipated reversal (for seconds, minutes, or days), or you’re chasing the market.
You make the call.
There really is no other choice.
Both methods involve psychological pain.
Referring back to Prechter, he also said some of the best traders he knew were former Marines. By definition, they are well trained to deal with pain.
My former mentor, the late David Weis would say after hit on a set-up, if conditions warranted, he would enter again; as he told me, he would ‘stick his chin out’ and effectively tell the market to ‘prove him wrong’.
It was an interesting choice of words for him as one can see from his training video …. he had a distinctive chin.
Trading Style:
The trading style presented on this site is a combination of Wyckoff tape reading coupled with anticipating price action.
As inferred above, that means there may (and will ) be times of draw-down while working to enter a market reversal.
That’s where we are now.
Trade Actions:
Yesterday’s upward action in basic materials forced the ‘project’ out of its short (SMN) position. That sector may attempt to make a new 52-week recovery high before it’s ready for reversal.
Analysis: Real Estate, IYR
One market that did make a new 52-week high, setting up technically for a short, is real estate:
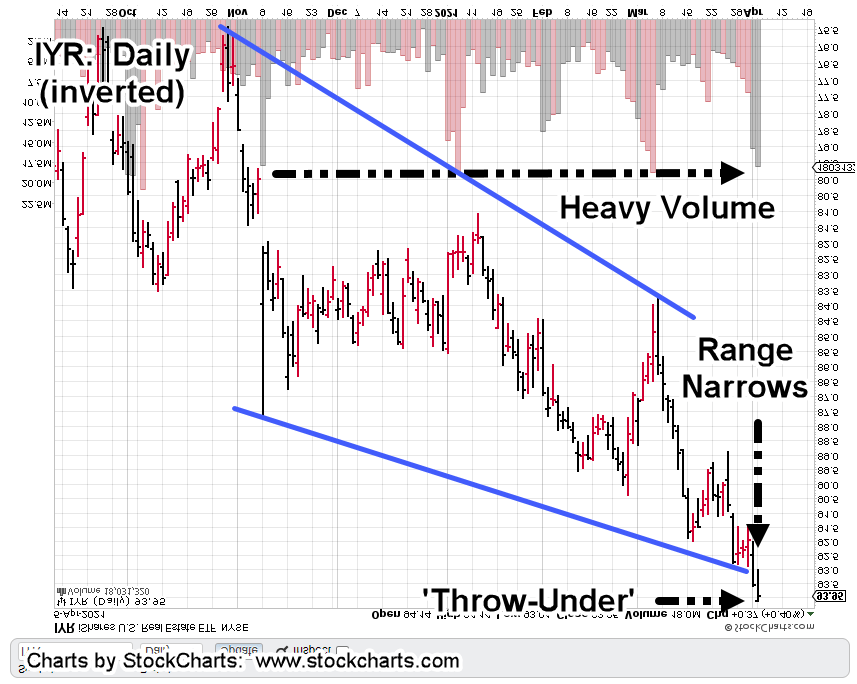
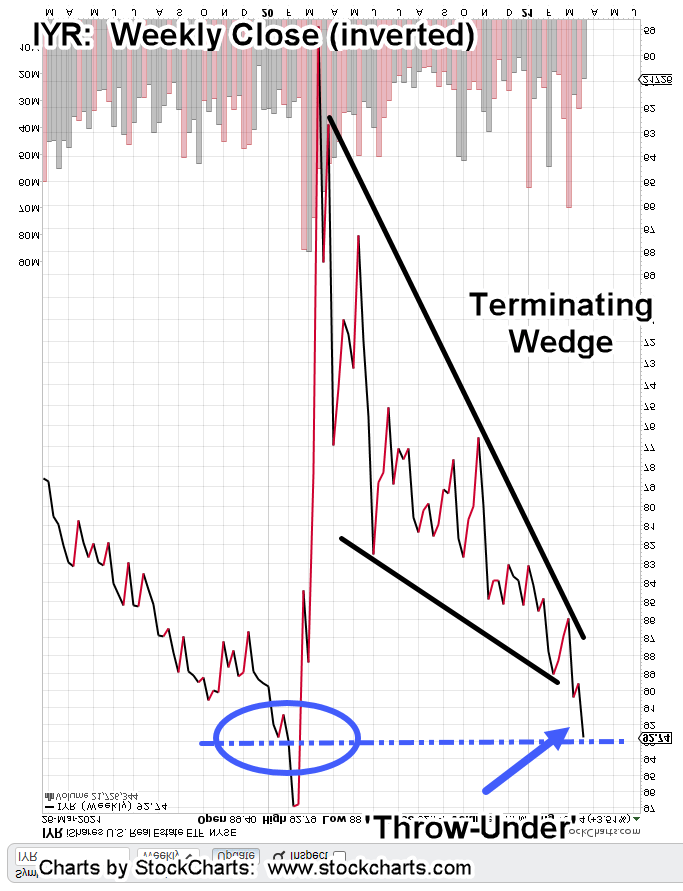
The weekly close of IYR has been inverted (turned upside down) to show the unique technical condition.
IYR has created a large terminating wedge that’s in the process of a ‘throw-under’. At times a market will attempt to breakout of a wedge in the opposite direction of eventual reversal.
This type of breakout tends to fail. Based on the dashed line contacting a prior congestion, there’s’ potential to at least hesitate in this area.
The daily chart below provides additional nuance:
It’s clear price action has contacted two prior areas of support – resistance during ‘throw-under’.
Anything can happen but it seems that IYR’s at maximum extension.
On Friday, IYR price action closed just 0.05-points off its high for the day. That high was also a 52-week high.
We’re now in a support-resistance zone.
If IYR is to move significantly higher, it might need additional fuel (a retrace lower) to break through.
Positioning:
The action then (not advice, not a recommendation) was to short the market via DRV.
Once again, the market itself is telling us where to go for opportunity.
Note: Posts on this site are for education purposes only. They provide one firm’s insight on the markets. Not investment advice. See additional disclaimer here.
Note: Posts on this site are for education purposes only. They provide one firm’s insight on the markets. Not investment advice. See additional disclaimer here.