Who’s Retracing The Least?
Today was a sharply higher in the SOXX, with 50% retrace (from the 3/25, high) on both a close and print basis.
The short trade, SOXS-26-01, was stopped-out (with profit) as yesterdays’ low was hit.
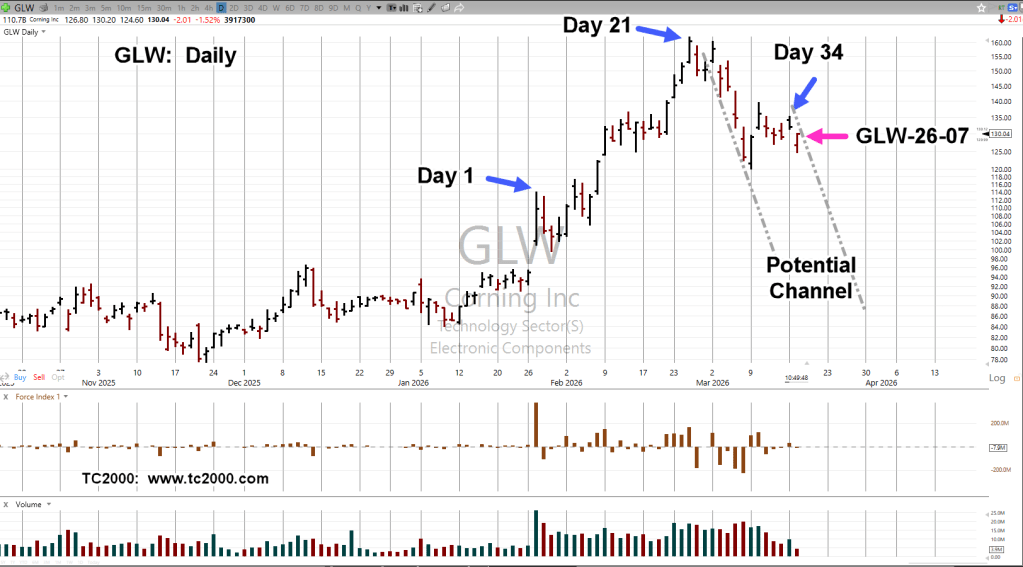
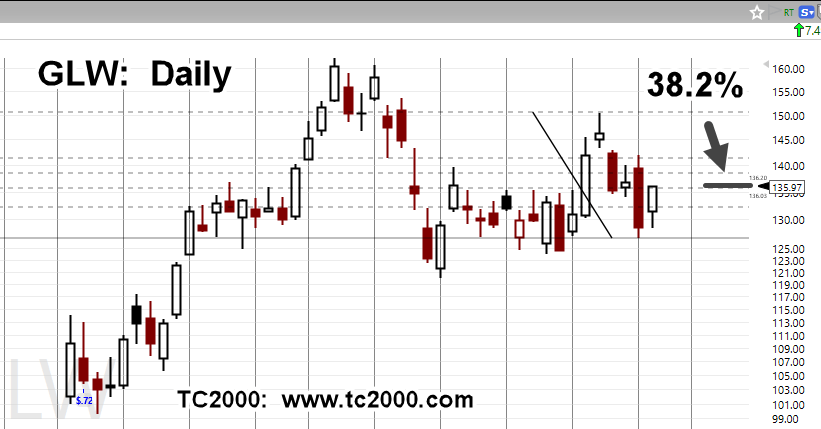
Looking at price action, Corning GLW, had ‘ease-of-movement’ lower yesterday, only partially retraced today (unlike SOXX and NVDA, for example).
In addition, the retrace was 38.2%, on both a print and close basis (lower than SOXX).
Repositioned short, as GLW-26-09, with stop at Monday’s high (not advice, not a recommendation).
Stay Tuned
Charts by StockCharts
Note: Posts on this site are for education purposes only. They provide one firm’s insight on the markets. Not investment advice. See additional disclaimer here.
The Danger Point®, trade mark: No. 6,505,279