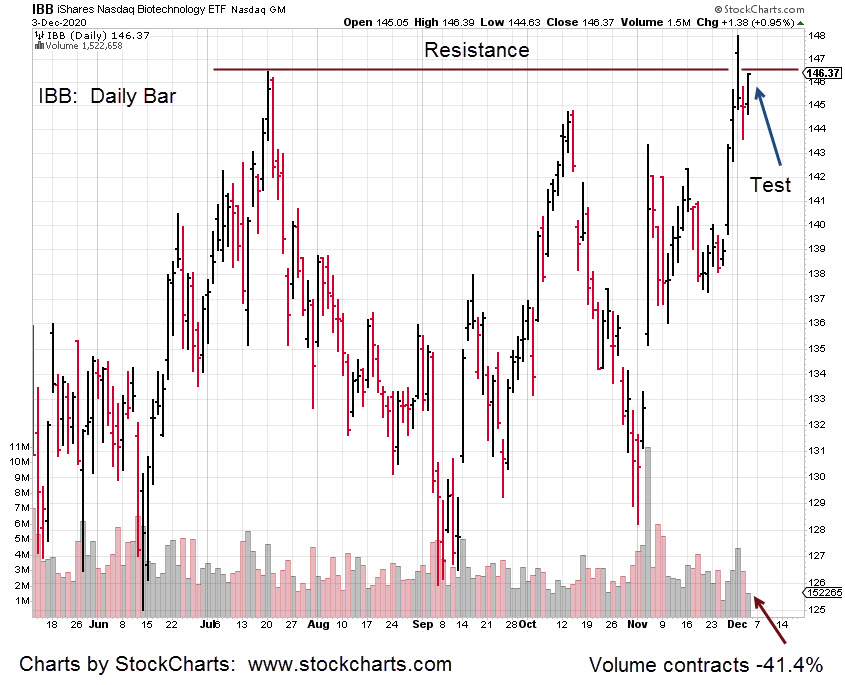
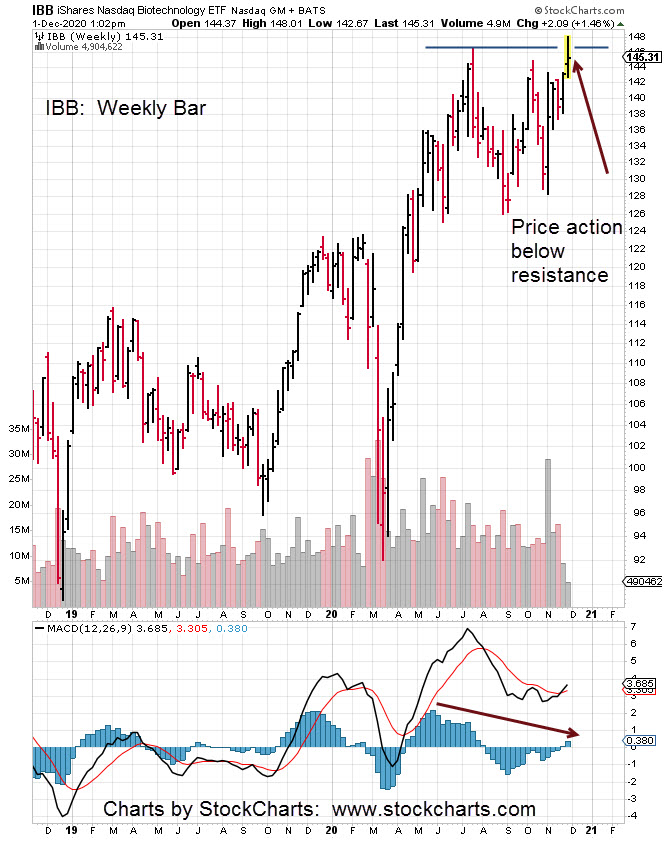
If IBB is able to finish below resistance at 148, it will post a daily reversal bar.
Original upside target was the 150-area. Looks like at this juncture, 149.31 may be all there is.
Hourly chart of IBB with notes, below.
Positioned short (not advice, not a recommendation), via BIS and LABD (separate accounts).
Stop: BIS 24.64, LABD 27.63
Note: Posts on this site are for education purposes only. They provide one firm’s insight on the markets. Not investment advice. See additional disclaimer here.
The final arbiter is price action itself. We can analyze all we want but if the position does not cooperate, it’s time to leave.
Similar to closing nat-gas positions on November 3rd, as detailed here, it’s time to move on from Biotech; let it play out without us.
Biotech’s not working on the short side. So, we’ll come back when it is.
It’s important to note, after leaving UNG, it’s -21.2%, lower than November 3rd.
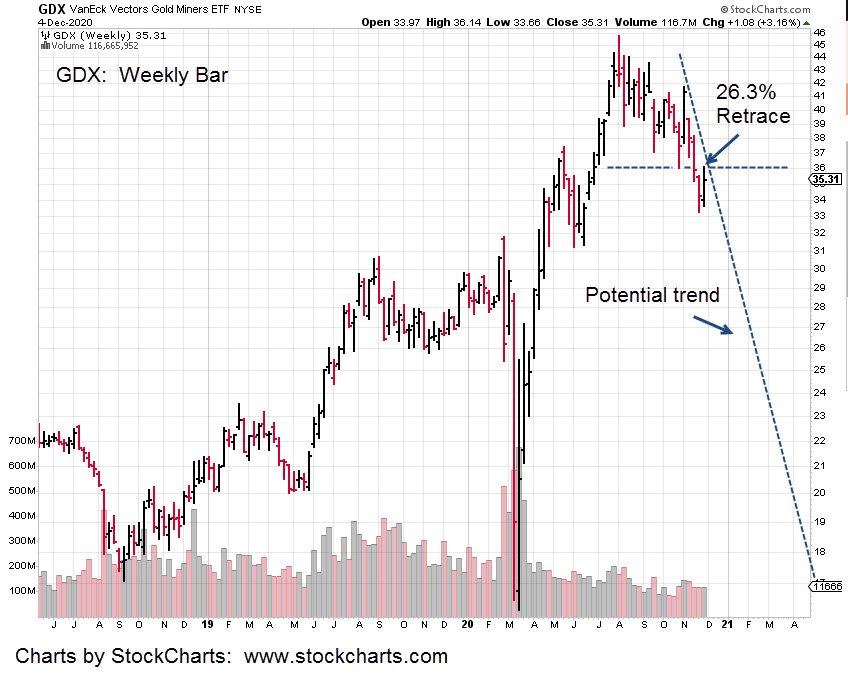
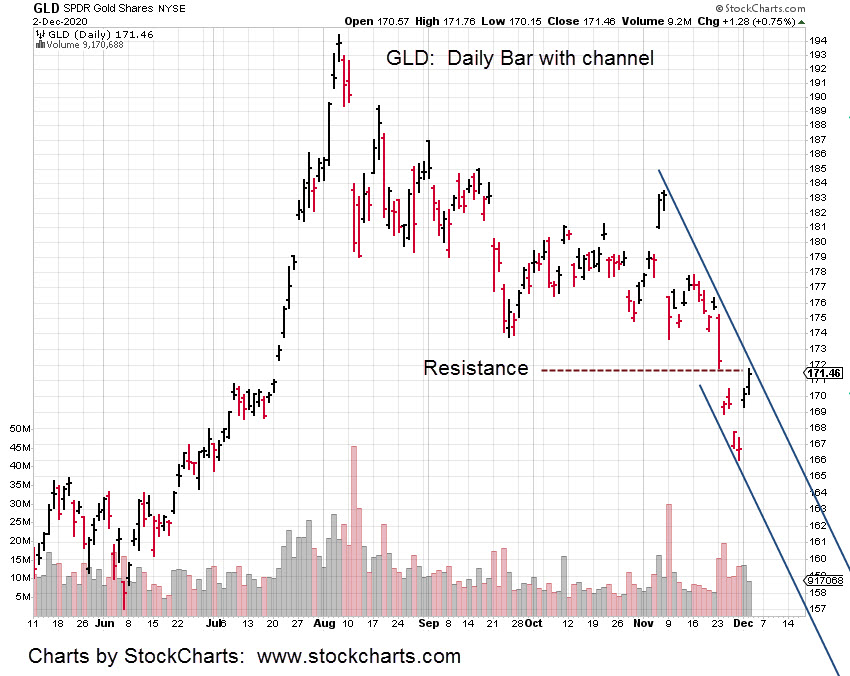
What’s working (for shorting), is gold and the miners (GDX) via DUST (not advice, not a recommendation). The GDX chart below shows the resistance level which is also the 23.6%, retrace.
A Fibonacci 23.6%, retrace is rare.
If that level is not challenged and GDX continues lower, the shallow retrace (to the upside) indicates significant weakness.
Recap: Markets (S&P, Dow, NASDAQ) at all time highs. The 30-yr Bond and Dollar, at short level extremes; the most in history.
Gold and GDX appear to be out in front, leading the way lower.
Note: Posts on this site are for education purposes only. They provide one firm’s insight on the markets. Not investment advice. See additional disclaimer here.
In the pre-market (8:52 a.m. EST) action continues to grind higher. Both the Dow and S&P have posted new highs thus negating the Holiday Turns scenario … but not by much.
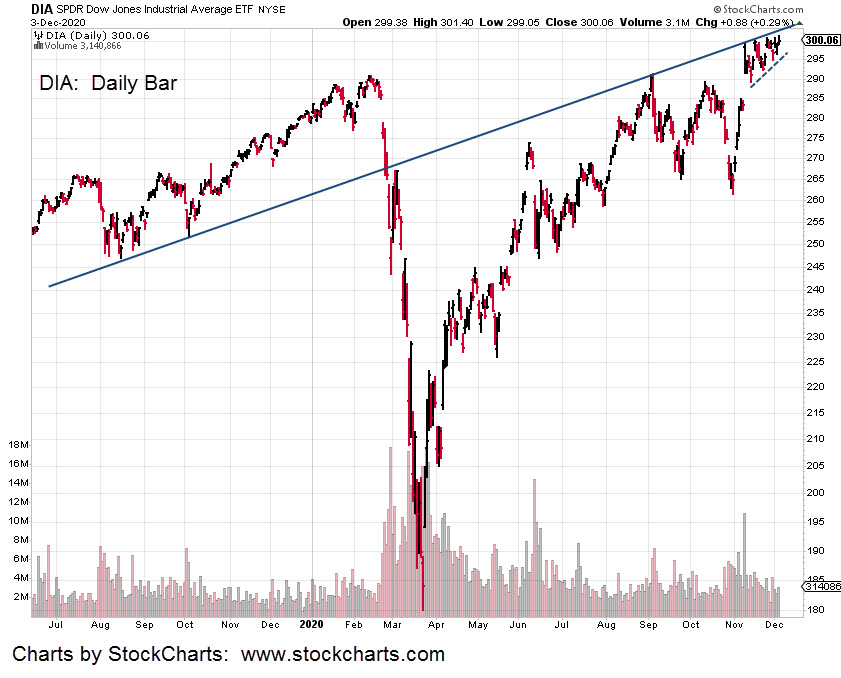
Important to note is each market continues to post on the underside of a long-term trend-line. The Dow chart (DIA) is farther down this post.
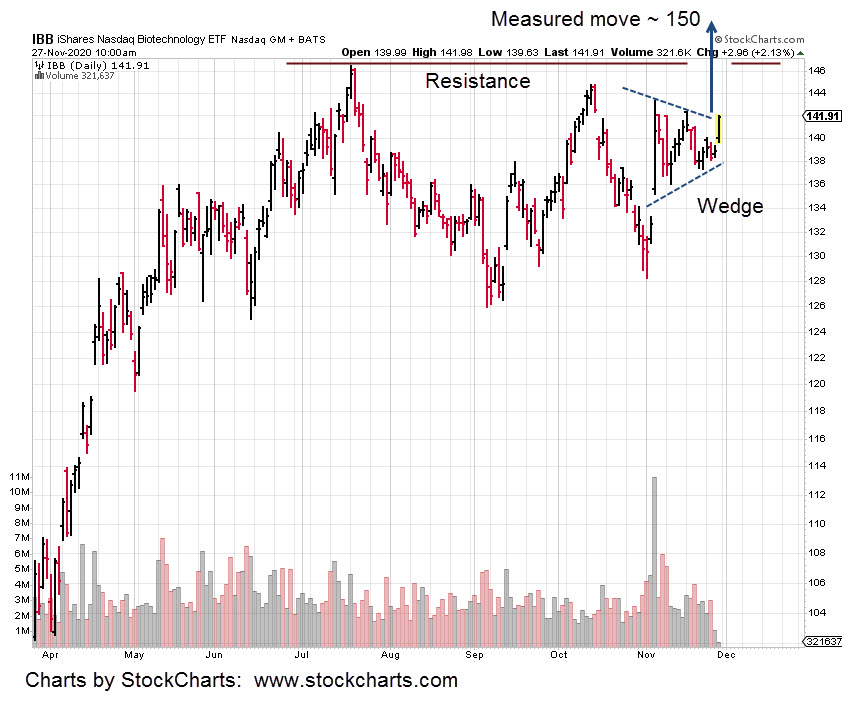
Also added to the chart is the dashed trend-line underneath the recent price action. A wedge is being formed; typically last stop before reversal.
In other markets, looks like Biotech may continue higher but along with the others, action appears labored.
The short position could be stopped out at the open.
This area of price action is where cost of being wrong is least. We’re at The Danger Point.
Update: 9:04 a.m. EST: Both AMGN and MRNA have now posted lower in pre-market.
Stopped out does not mean there’s no opportunity. The bearish MACD divergence is still there.
If IBB continues higher, the original ‘150’ target is back in play.
The market extremes are still there: Bonds and the Dollar are short the most in history. Stretched all around.
It’s not unreasonable to expect several attempts to position short.
Note: Posts on this site are for education purposes only. They provide one firm’s insight on the markets. Not investment advice. See additional disclaimer here.
Note: Posts on this site are for education purposes only. They provide one firm’s insight on the markets. Not investment advice. See additional disclaimer here.
If the trend is in-effect as shown, GLD could reverse tomorrow or in the overnight session.
The senior miners (GDX) stalled during today’s session. Price action is still at the Fibonacci 23.6%, retrace level.
To help clarify the firm’s positions, the following detail is provided as a courtesy only.
Several accounts are being managed. Currently there are two open positions in separate accounts (not advice, not a recommendation):
Managed Accounts
Detail Position Stop
Short GDX DUST 20.44
Short IBB BIS 25.46
Everyone has their own style. Ours adheres to tenets laid down by three market masters from the early 1900s. Detail on those criteria can be found here.
One of the reasons for choosing Livermore, Wyckoff and Loeb, is that no evidence exists these individuals were part of any full scale corruption or being the lap-dog for the globalist elite.
That statement is the complete opposite of what we have today. At this stage, the corruption and lap-doggery should be obvious to all.
Note: Posts on this site are for education purposes only. They provide one firm’s insight on the markets. Not investment advice. See additional disclaimer here.
Attempted breakout that failed … thus far. That was today’s action for Biotech (IBB).
The (weekly MACD) divergence set-up has been in the works for awhile. The first time weekly MACD was discussed was this report nearly two months ago.
With the Dow reaching an apparent top last Tuesday and with other markets (S&P, NASDAQ) following suit today, there’s potential we’re at a pivot point.
Note that Biotech’s all time closing high remains IBB 145.80, reached back on July 20th, this year.
Volume for today’s session increased 43% over yesterday. However this session only pushed 0.23%, higher; opposed to a 1.23%, gain on Monday.
Upward progress slowed significantly in the face of higher volume. The bulls are tired.
While external world chaos rages, here, here and here, we’re focused on price action and taking advantage of low risk opportunities.
The response was to go short via BIS (not advice, not a recommendation) at BIS 25.61, with a stop set at BIS 25.46.
Note on stops and trading:
Every speculator has their style. We’re perfectly comfortable getting stopped out and re-entering several times on what is considered a viable set-up.
The current position may be stopped out at the next session. Depending on the price action at the time, the bearish divergence on the weekly may still be in effect and allow for a re-entry into the trade.
Note: Posts on this site are for education purposes only. They provide one firm’s insight on the markets. Not investment advice. See additional disclaimer here.
Note: Posts on this site are for education purposes only. They provide one firm’s insight on the markets. Not investment advice. See additional disclaimer here.
Note: Posts on this site are for education purposes only. They provide one firm’s insight on the markets. Not investment advice. See additional disclaimer here.
It’s the heavy hitter. If we decipher what’s going on with it, then we can trade biotech for (potential) profit.
The chart shows price action began to retrace off the lows for the week. In doing so, it created a possible neckline.
The 38% retrace area, marked with the dashed line, also shows it’s a juncture between weekly bars; the circled area.
That’s a trading tip … watch the circle.
If price action gets to 38% and stalls, it shows weakness.
Our interest is to look for shorting opportunities. Specifically, via the 2X Inverse Biotech, BIS.
For years now, except for energy (nat-gas) and commodities (corn, wheat, et al), markets are being worked from the short side.
Steven Van Metre presents an excellent case for a deflationary impulse first before there’s any inflation.
The ‘macro’ as he calls it, provides a backdrop for what’s really going on.
For now, the action (not advice, not a recommendation) is to watch AMGN play out. If the trading is choppy, overlapping and laboring into the 38% level, then we have our answer.
Note: Posts on this site are for education purposes only. They provide one firm’s insight on the markets. Not investment advice. See additional disclaimer here.
Note: Posts on this site are for education purposes only. They provide one firm’s insight on the markets. Not investment advice. See additional disclaimer here.