CarMax in The Lane

Charts by StockCharts

Note:  Posts on this site are for education purposes only.  They provide one firm’s insight on the markets.  Not investment advice.  See additional disclaimer here.

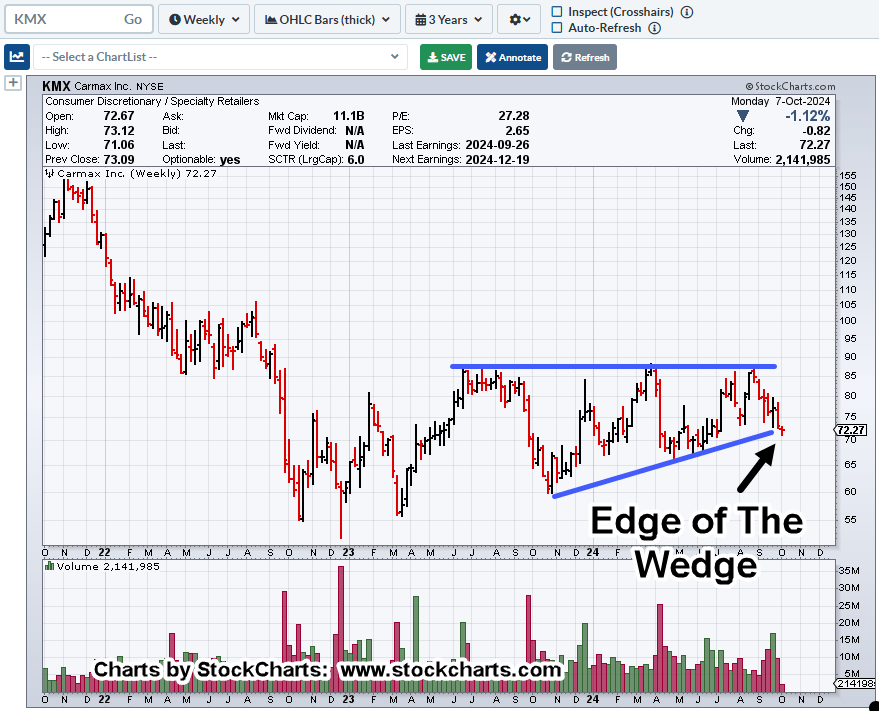
CarMax … Edge of The Wedge

Charts by StockCharts

Note:  Posts on this site are for education purposes only.  They provide one firm’s insight on the markets.  Not investment advice.  See additional disclaimer here.

CarMax … At The Edge

Charts by StockCharts

Note:  Posts on this site are for education purposes only.  They provide one firm’s insight on the markets.  Not investment advice.  See additional disclaimer here.

Fed Leader … or … Fed Follower

Charts by StockCharts

Note:  Posts on this site are for education purposes only.  They provide one firm’s insight on the markets.  Not investment advice.  See additional disclaimer here.

Fighting The ‘Collapse’

Charts by StockCharts

Note:  Posts on this site are for education purposes only.  They provide one firm’s insight on the markets.  Not investment advice.  See additional disclaimer here.

CarMax (Crash) Clues

Hits ‘Target’, Then Reversal

Sales down, earnings down, car prices down, demand collapsing and yet, KMX, goes higher.

Frist off, let’s address the ‘clown show’ that bandies about ‘crash’ this, and ‘crash’ that … ad infinitum.

After you’ve said crash fifteen, thirty times or more on your YouTube channel, nobody’s listening when it really happens.

How about we all (myself included) take a cue from the late Dr. Martin Zweig as seen here, (time stamp 6:40) where he’s reluctant to say ‘crash’ even when it’s on the eve of Black Monday 1987.

Now, back to our update.

CarMax … Strategy

So, let’s review the CarMax situation from a calm but focused perspective.

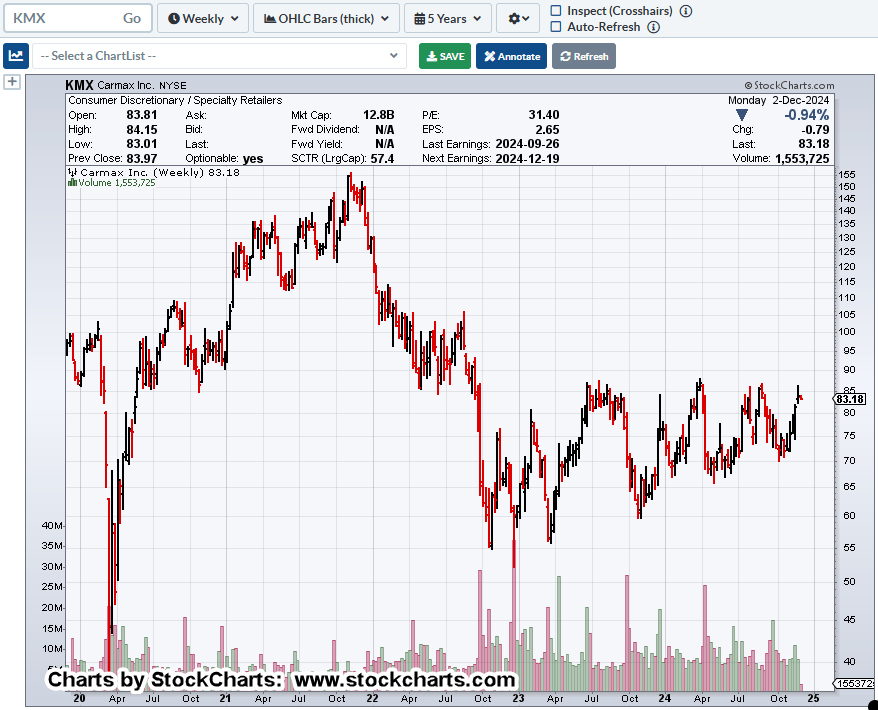
Strategically, KMX has met the price target identified last October (link here), and has apparently reversed.

The ‘Dead Cat’ Has Bounced

So, was last Friday’s earnings release high of 87.06, close enough to the ’85-area’ as forecasted?

As the magenta arrow shows, there could be small blip up to resistance in the 85-area before potentially rolling over into a descent that projects to the 4.00, level.”

It took over eight months to get back to the ’85-level’.

What happens next?

Fundamental Forces

It’s been the premise of this site, we’re at the beginning stages of the largest financial, social, and population collapse ever seen (not advice, not a recommendation).

From a CarMax perspective, we have this just out yesterday.

Car lots are overflowing and we’re playing musical chairs with inventory to make it look like something’s happening.

Next, we have a Ford employee writing in, to Jeremiah Babe, saying the Electrical Vehicle Plant is a “ghost town”.

What does that ‘clean energy’ ghost town mean for silver demand? Ah, but I digress. 🙂

We’re most likely just getting started. For a snapshot into what may come our way, take a look at this.

Now, on to the chart

CarMax (KMX) Quarterly Bar

The original chart from October 2022, is repeated below.

Now, the update.

CarMax, KMX, Daily Bar

When looking at the daily, we see we’re in Wyckoff Up-Thrust (reversal) condition.

We’re at The Danger Point®

Just so we’re not one-sided, here’s a bullish forecast for KMX (not advice, not a recommendation).

At this juncture, there’re no plans to go short (not advice, not a recommendation) … although it may not be a bad spot considering all the forces lining up.

An obvious stop level (for a short) would be last Friday’s high of KMX 87.06 (not advice, not a recommendation).

Stay Tuned

Charts by StockCharts

Note:  Posts on this site are for education purposes only.  They provide one firm’s insight on the markets.  Not investment advice.  See additional disclaimer here.

The Danger Point®, trade mark: No. 6,505,279

Short Covering, Into The Close ?

Watch For The Weakest

With today’s heavy downward action, as we head into the close, any number of scenarios could play out.

Work has already been done on INTC, KMX, MRNA, Biotech Leveraged Inverse LABD, and others.

With such a decisive push lower, there could be some kind of short covering late in the session.

For example, as of this post 2:15 p.m. EST, KMX (detailed below) appears to be coming off the day’s lows.

CarMax Weakness

The daily chart has KMX, right a the bottom of a trading channel.

Price action may continue to rebound from this area heading into the close or not.

If there’s a rebound, naturally Put options will begin to decay in value … a desired outcome if one is looking to enter short (at the cheapest price possible).

The bottom of the channel line could be all there is for this week or we could be heading to much lower levels.

It’s up to the trader/speculator to decide (not advice, not a recommendation)

Stay Tuned

Charts by StockCharts

Note:  Posts on this site are for education purposes only.  They provide one firm’s insight on the markets.  Not investment advice.  See additional disclaimer here.

The Danger Point®, trade mark: No. 6,505,279
The Moderna Scenario(s)

Potential Moves … Potential Actions

In the markets, anything can happen.

With that understood, we’ll present three potential scenarios for Moderna (MRNA) price action for the upcoming days, or week(s).

When we last left our chief cook and spike-protein injector, price action was in a downtrend but also in Wyckoff spring position; indicating at least a chance for upside.

As with the CarMax (KMX) analysis, still playing out with Scenario No. 2, and/or No. 3, at this link as the forecasted price action, we’ll show potential Scenario No. 1 – No. 3, for MRNA, below.

Moderna MRNA, Daily, Forecasted Action

Scenario No. 1

Upside wedge breakout

Scenario No. 2

Downside wedge breakout with no test

And now, the most probable, ‘If there’s a downside breakout.

From a short-dated options standpoint, Scenario No. 3, is the most desirable (not advice, not a recommendation).

If there’s a downside breakout with no test, there’s always the possibility at some point, there will be a test, which in turn completely wipes out any potential gain in the (put) trade; time would run out and the option expires.

Re-Visiting, Elder

Recall, in the example that Dr. Elder gave, he bought OEX Put Options at 3/8-ths, back in the day when the markets traded in fractions.

Three-eighths is 0.375, which gives a target value on which option to select (not advice, not a recommendation).

To get to that small of a fraction, the option’s either way out of the money, short on time, or both.

Stay Tuned

Charts by StockCharts

Note:  Posts on this site are for education purposes only.  They provide one firm’s insight on the markets.  Not investment advice.  See additional disclaimer here.

The Danger Point®, trade mark: No. 6,505,279

The Moderna ‘Channel’ … Redux

… And The Weekly, ‘Summary & Strategy’

The last update about our chief cook and bottle washer of gene ‘modification’ had this to say about price action.

“We’re about forty minutes into the session; Moderna (MRNA) has just confirmed the up-thrust reversal discussed in the last update“.

From that point Moderna (MRNA) declined for seven weeks for a total of around – 31.5%.

However, that’s not the most important part.

In that update, a trading channel was shown which at the time, was declining at – 93.7%, on an annualized basis.

Well, the channel is back.

Only this time, probabilities and price action have come together to set up for a potential sustained decline.

Moderna MRNA, Weekly

Above, we have a Wyckoff ‘Up-Thrust’ and a test that has since turned lower.

Next, we have a series of repeating trend or channel lines.

Additional data has modified the downward slope to be declining at approximately – 90%, annualized.

From a fundamental standpoint, the data set is enormous on the events of the past three years.

At some point that data could provide a huge tailwind for downside action.

For now however, let’s stick with what price action is telling us and go to the Summary & Strategy

Summary & Strategy

The past week has identified two areas of position or trade execution and two areas for possible short-term options execution (not advice, not a recommendation):

Position or Trade: Real Estate IYR, and Biotech SPBIO

Options: Carmax KMX, and Moderna MRNA

As a reminder, most if not all trade analysis is for the short side (not advice, not a recommendation).

Final Thoughts

Since we have possibly the largest bull trap in market history with huge numbers of VIX Call options, the following week may be subdued by going modestly up, sideways or down, slowly.

With that said, options positioning (if any) could be slated for the week of 2/17/23.

As always, price action is the final arbiter.

Stay Tuned

Charts by StockCharts

Note:  Posts on this site are for education purposes only.  They provide one firm’s insight on the markets.  Not investment advice.  See additional disclaimer here.

The Danger Point®, trade mark: No. 6,505,279

CarMax … Dead Cat Bounce

That, Was Then …

Back in October last year, the update on CarMax, said this:

“… there could be small blip up to resistance in the 85-area before potentially rolling over into a descent that projects to the 4.00, level.

If and when that happens, CarMax rival Carvana, may be long gone; its disruptive vending machines possibly being used as homeless shelters or insect farms.”

Even with the short-squeeze mania last week, rival Carvana, remains down a blistering – 96.2%, from its all-time highs; having reached an interim low of – 99.1%, in December.

Insect farms, dead-ahead. 🙂

The ‘Bounce’

So, does getting to a high of KMX 80.92, meet the forecast of “the 85-area” ?

It looks close enough, but the real story is the bearish trade set-up.

I’ve lost track of the number of Wyckoff ‘Spring to Up-Thrust’, set-ups that have been covered since this post, over sixteen months ago; we now have another.

CarMax KMX, Weekly

Unmarked chart.

Long time users should be able to spot the set-up immediately.

For those new to the site or if more clarification is needed, here it is:

Getting down to the daily, is where a trading plan is created.

KMX, Daily

Several scenarios.

Three potential scenarios are below.

Remember, we’re in possibly the largest bull-trap in market history.

Those in control of the markets need to bleed-off the VIX Call options values by having the market go up, sideways, or down slowly (at first).

Here is the VIX Option expiration calendar for 2023-2025.

Going straight down at this juncture (although anything can happen), is not the most probable outcome.

Scenario No. 1

Lower open at the next session, followed by a labored move to test the underside of resistance.

The test can happen in one day or several days.

Scenario No. 2

Next up, is congestion tests before heading lower.

Scenario No. 3

Lastly, a steady but ratcheting move lower.

These are just three potential outcomes of an infinite number.

The market itself will give clues at the next session to the more probable outcome.

Summary

It may be after the 15th (past VIX option expiration), before there is a decisive move lower.

Not covered in this update is what happens if KMX, actually goes higher instead of lower. If that happens, we’ll post updates as necessary.

Stay Tuned

Charts by StockCharts

Note:  Posts on this site are for education purposes only.  They provide one firm’s insight on the markets.  Not investment advice.  See additional disclaimer here.

The Danger Point®, trade mark: No. 6,505,279