‘Real Opportunities Are Rare’ … Gerald M. Loeb

Now that one pillar of the A.I. mania has vaporized, ‘what’s next?’
To begin the search, let’s start with this headline from yesterday:
“No One Was Buying”: An Ominous Post-Mortem Of What Happened Today From Goldman’s Trading Desk, link here.
That may tell us all we need to know.
But of course, it can’t be that simple. We have to make it complicated with ‘experts’ piling on, pontificating about ‘earnings growth’, ‘multiples’ and the like.
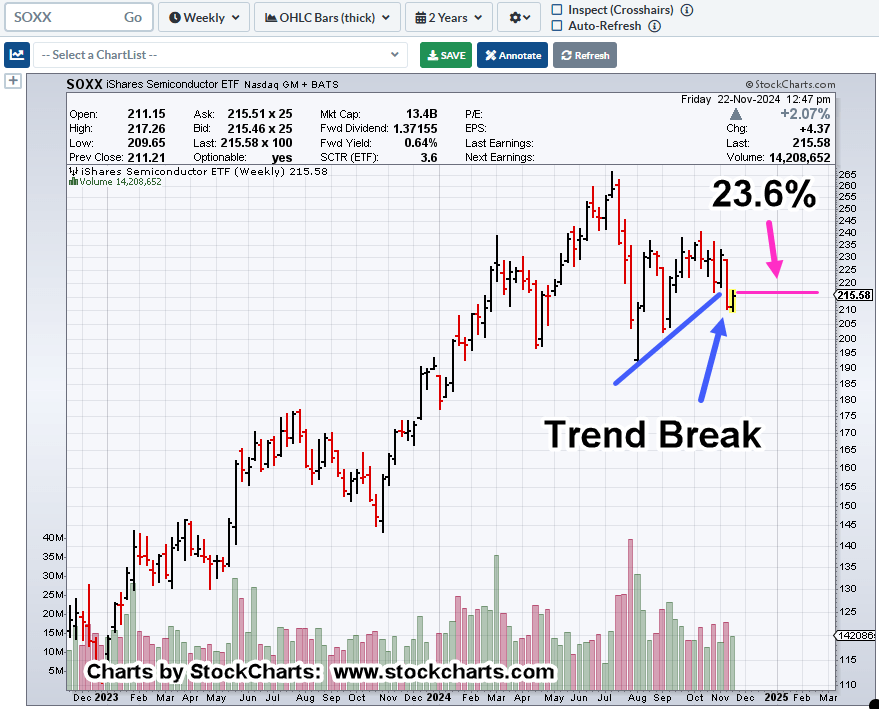
However, did any of that play into identifying the SOXX reversal, almost to the day?
Short answer is, no.
So, why would it be a factor in determining the most likely (next) outcome?
With that, let’s take a look at the chart.
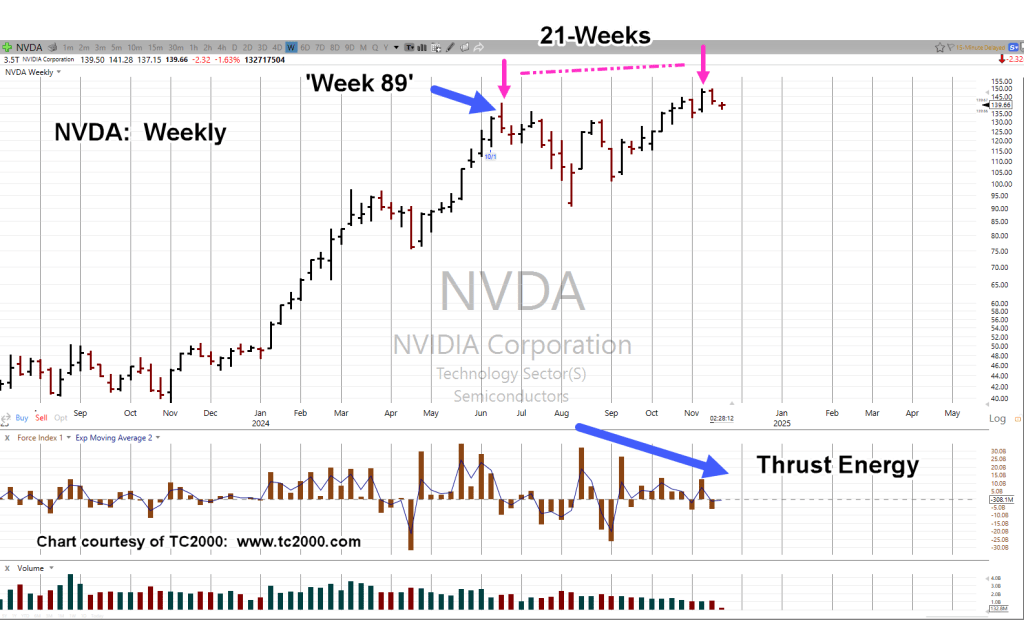
Nvidia NVDA, Daily
It’s an aggressive viewpoint; that is, NVDA’s not going to fill the gap and is in the midst of a sustained down-move (not advice, not a recommendation).

If the A.I. bubble, potentially the largest bubble since the South Sea, imploded yesterday, the chart seems like a reasonable viewpoint (definitely not advice, not a recommendation).
Loeb & Focus
Few people talk about Gerald M. Loeb, late Vice Chairman for E.F. Hutton
He’s the one that said to ‘focus’ one’s efforts on the few and rare, real opportunities.
With that said, NVDA and the SOXX are moving now, while other market appears stagnant.
Therefore, the focus is on this sector (not advice, not a recommendation).
Stay Tuned
Charts by StockCharts
Note: Posts on this site are for education purposes only. They provide one firm’s insight on the markets. Not investment advice. See additional disclaimer here.
The Danger Point®, trade mark: No. 6,505,279