Spike Lower, or Long Term?

Seven weeks ago, was this post, giving a ‘heads up’, gold (GLD), had just printed massive upward thrust energy.
A print like that, happened only once before, near the 2011, top.
From that top, GLD, traded in a range for over a year before heading into a sustained decline.
That decline lasted three years, GLD down -46%.
So, here we are. 🙂
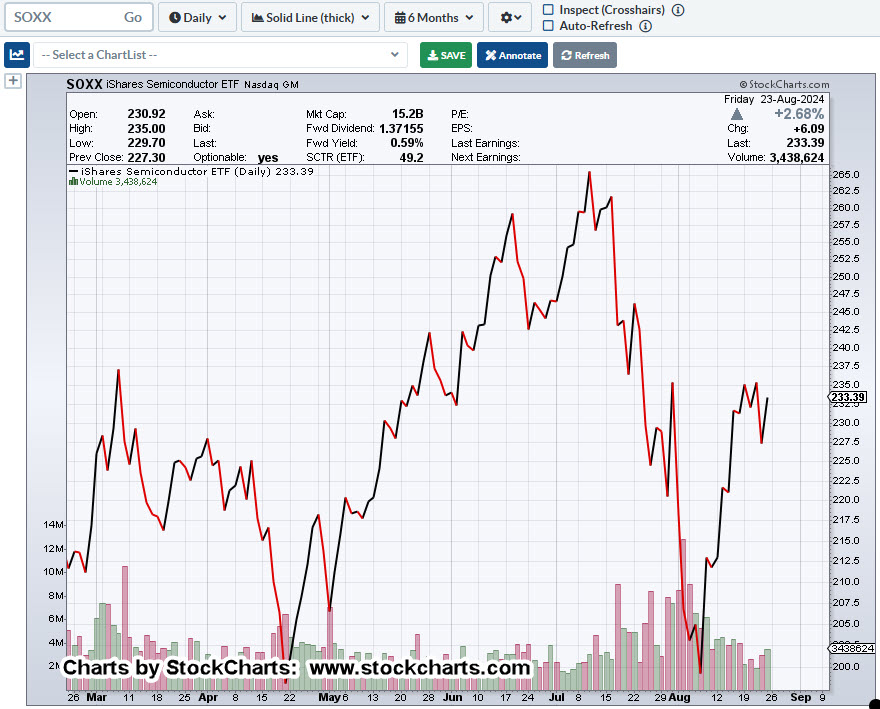
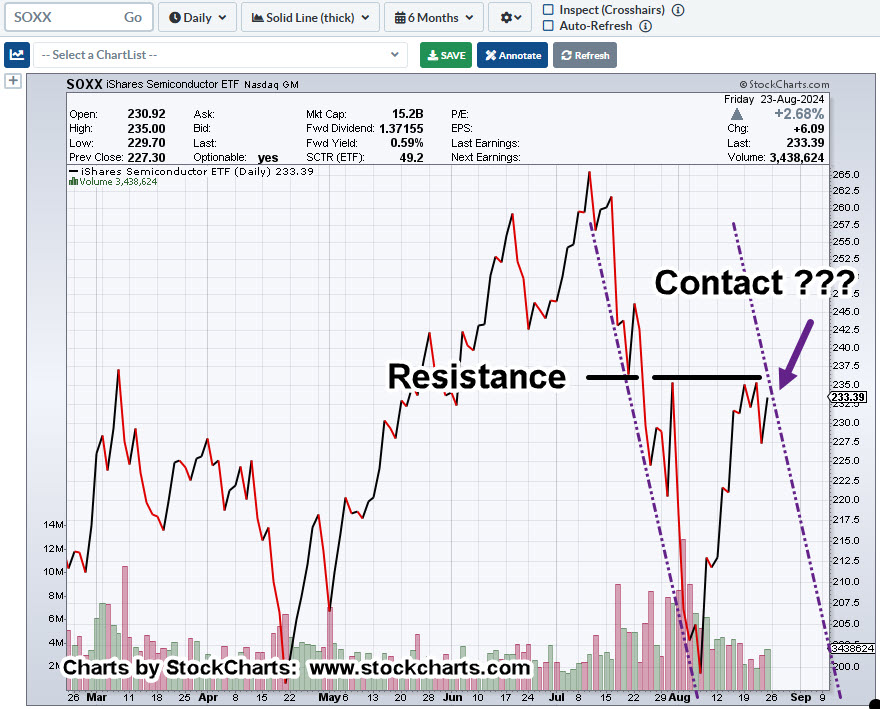
We’ve posted massive upward thrust energy seen only once before, a potential top, sideways action for just over two-months; then, trend breaks down.
Sounds about right.
Now, all-of-a sudden, professionals may be selling (or set, to sell), link here (not advice, not a recommendation).
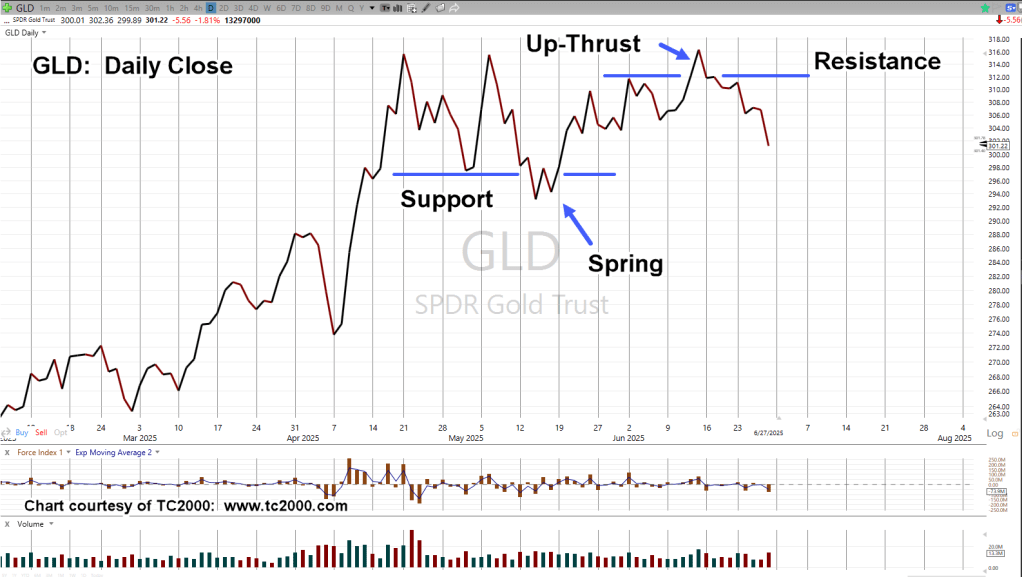
Gold GLD, Daily Close
We’re going to look at GLD, a bit differently. That is, the repeating pattern of Spring-to-Up-Thrust, link here.
Human psychology does not change.
Buying on the way down.
From ‘One Way Pockets’, first published in 1917, the author had access to client accounts, analyzing their behavior over bull and bear cycles.
From his findings:
Once a stock had reached its peak and started a long decline, that’s where most of it was ‘handed out’. Sold to the public as it was moving lower … then, lower, still.
Wyckoff seconds this truth; ‘those on the wrong side of the trade, provide (most of) the fuel, for the way lower’.
Short Term, Long Term, or Not at All
As this update presented, we’ve had a potential top indication for GLD that’s only happened once before.
The last time, it was over four years before GLD, bottomed and started the next bull run.
It’s impossible to know if this time is different.
However, price action itself, will tell us the next probable direction.
Stay Tuned
Charts by StockCharts
Note: Posts on this site are for education purposes only. They provide one firm’s insight on the markets. Not investment advice. See additional disclaimer here.
The Danger Point®, trade mark: No. 6,505,279